Overview
GRE data traps represent one of the most insidious categories of question design on the Quantitative Reasoning section. These traps are deliberately constructed scenarios where the test-makers present data in ways that encourage hasty, intuitive—but incorrect—conclusions. Unlike straightforward computational problems, data trap questions assess whether test-takers can maintain analytical discipline when confronted with misleading presentations, incomplete information, or cleverly disguised complexity. The GRE uses these traps to differentiate between students who merely calculate quickly and those who think critically about what data actually represents.
Understanding gre data traps is essential because they appear across multiple question formats: Quantitative Comparison, Multiple Choice (single and multiple answer), and Numeric Entry questions. These traps frequently involve data interpretation questions featuring charts, graphs, tables, or word problems where the path of least resistance leads directly to an incorrect answer. The test-makers exploit common cognitive biases—such as assuming relationships that aren't stated, overlooking units of measurement, or confusing absolute values with percentages—to create questions where 60-70% of test-takers select the same wrong answer.
Within the broader Quantitative Reasoning framework, gre gre data traps connect intimately with data analysis, statistics, probability, and word problem interpretation. Mastering this topic doesn't just improve performance on trap questions themselves; it cultivates the skeptical, detail-oriented mindset necessary for achieving scores above the 160 threshold. This topic serves as a meta-skill that enhances performance across all quantitative domains by training students to question assumptions, verify what's actually being asked, and distinguish between what appears obvious and what is mathematically sound.
Learning Objectives
- [ ] Identify when GRE data traps is being tested
- [ ] Explain the core rule or strategy behind GRE data traps
- [ ] Apply GRE data traps to GRE-style questions accurately
- [ ] Distinguish between five major categories of data traps in under 30 seconds per question
- [ ] Develop a systematic verification process to catch trap elements before selecting answers
- [ ] Analyze data presentations to identify missing information that prevents definitive conclusions
Prerequisites
- Basic arithmetic operations: Essential for performing calculations once trap elements are identified and avoided
- Percentage and ratio concepts: Many data traps involve confusion between relative and absolute values
- Graph and chart interpretation: Traps frequently exploit misreading of axes, scales, and data representations
- Algebraic reasoning: Understanding variables and relationships helps identify when insufficient information is provided
- Reading comprehension fundamentals: Parsing exactly what questions ask versus what test-takers assume they ask
Why This Topic Matters
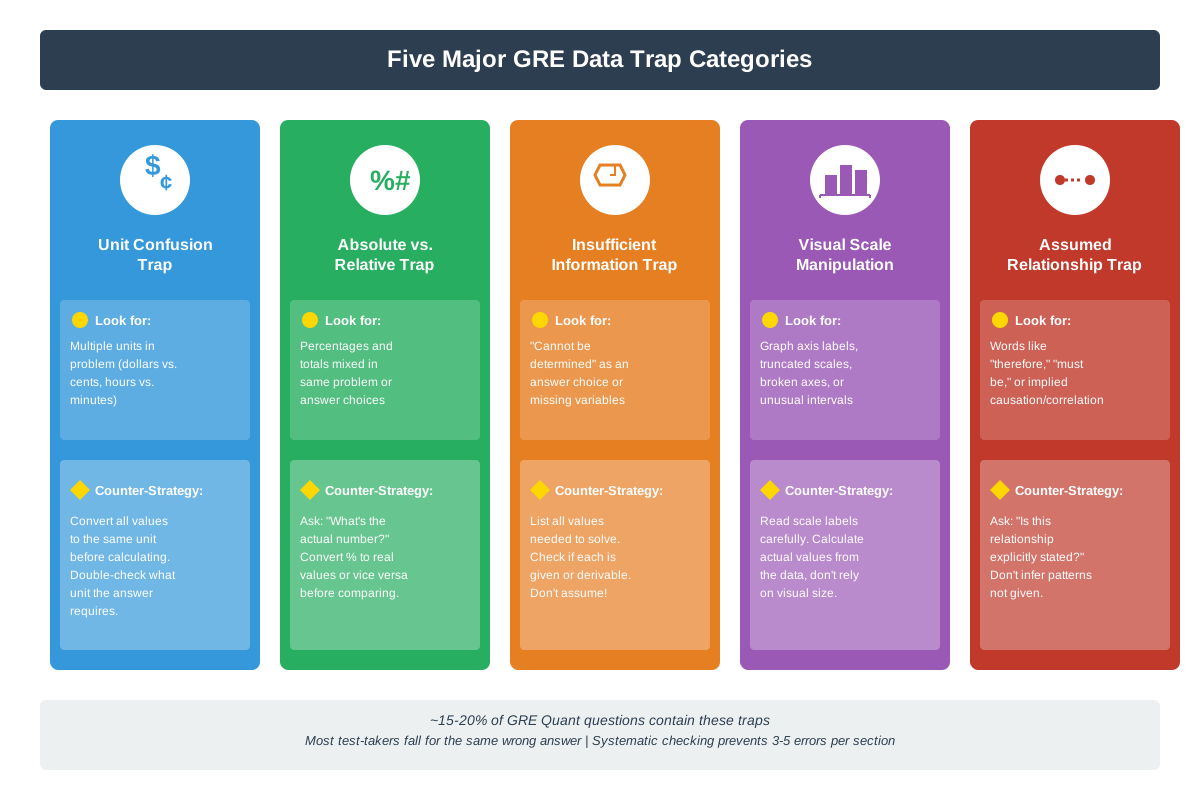
Data traps represent approximately 15-20% of all Quantitative Reasoning questions on the GRE, making them one of the highest-yield topics for score improvement. Unlike content gaps in geometry or algebra that require learning new formulas, data trap mastery primarily involves developing awareness and systematic checking habits. This means students can achieve dramatic score improvements in this area relatively quickly—often gaining 3-5 additional correct answers per section simply by recognizing trap patterns.
In real-world applications, the critical thinking skills developed through data trap awareness translate directly to professional contexts: evaluating business metrics, interpreting research findings, analyzing financial reports, and making data-driven decisions. Graduate programs value these skills because they indicate a student's ability to think rigorously rather than superficially.
On the GRE, data traps most commonly appear in questions involving: data interpretation sets (tables, graphs, charts), word problems with multiple steps, Quantitative Comparison questions with variables, percentage change problems, and rate/work problems. The test-makers strategically place these questions throughout the section, often positioning particularly deceptive traps in the middle difficulty range where test-takers have built confidence but may have relaxed their vigilance. Questions involving data traps typically feature answer choices where one option is significantly more popular than others among test-takers who fall for the trap—this is by design.
Core Concepts
The Five Major Categories of Data Traps
GRE data traps can be systematically classified into five primary categories, each exploiting different cognitive vulnerabilities:
1. Insufficient Information Traps: These questions provide data that appears complete but actually lacks critical information needed to reach a definitive answer. In Quantitative Comparison questions, this often means the correct answer is "Cannot be determined." The trap exploits test-takers' desire to use all provided information and their reluctance to select "insufficient data" options.
2. Unit and Scale Confusion Traps: These traps present data using different units, scales, or time periods, encouraging test-takers to compare values directly without proper conversion. Common examples include mixing thousands with millions, comparing percentages with absolute numbers, or switching between annual and monthly rates.
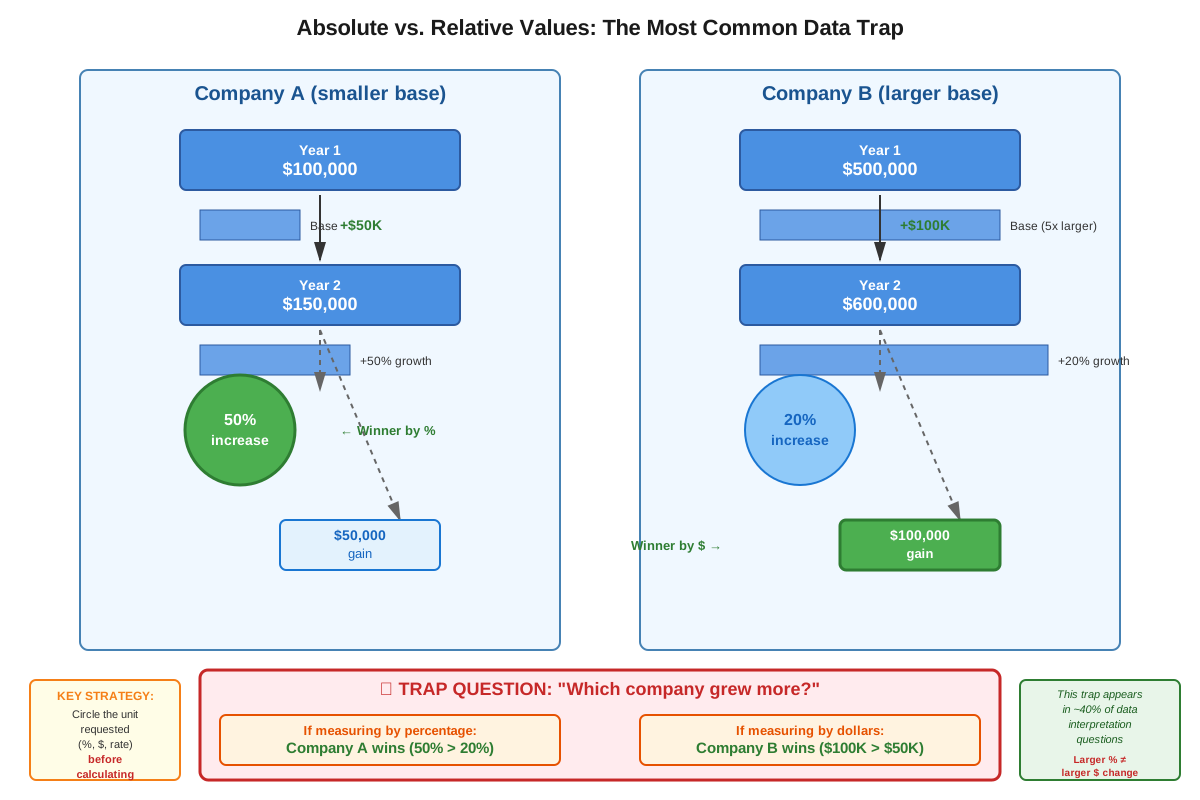
3. Percentage vs. Absolute Value Traps: Perhaps the most frequent trap type, these questions exploit confusion between relative changes (percentages) and absolute quantities. A 50% increase from a small base may be less in absolute terms than a 10% increase from a large base, but intuitive thinking often fails to account for this.
4. Assumption and Inference Traps: These questions present scenarios where test-takers must distinguish between what is explicitly stated and what seems reasonable to assume. The trap lies in making logical-seeming inferences that aren't mathematically justified by the given information.
5. Visual Misrepresentation Traps: In graph and chart questions, these traps use visual elements—truncated axes, non-zero baselines, area representations for linear data, or misleading aspect ratios—to create visual impressions that contradict the actual numerical relationships.
Recognizing Trap Indicators
Certain question characteristics serve as red flags that should trigger heightened scrutiny:
| Trap Indicator | What It Suggests | Appropriate Response |
|---|---|---|
| "Cannot be determined" is an option | Likely insufficient information trap | Verify every piece of needed data is provided |
| Multiple units mentioned | Unit confusion trap | Convert all values to common units before calculating |
| Percentages and raw numbers mixed | Percentage vs. absolute trap | Identify what the question actually asks for |
| Variables without constraints | Assumption trap | Test extreme values; don't assume positive integers |
| Graph with broken axis or unusual scale | Visual misrepresentation | Read actual values, ignore visual impressions |
| "Must be true" or "could be true" language | Logical precision trap | Distinguish between necessary and possible conclusions |
The Systematic Verification Process
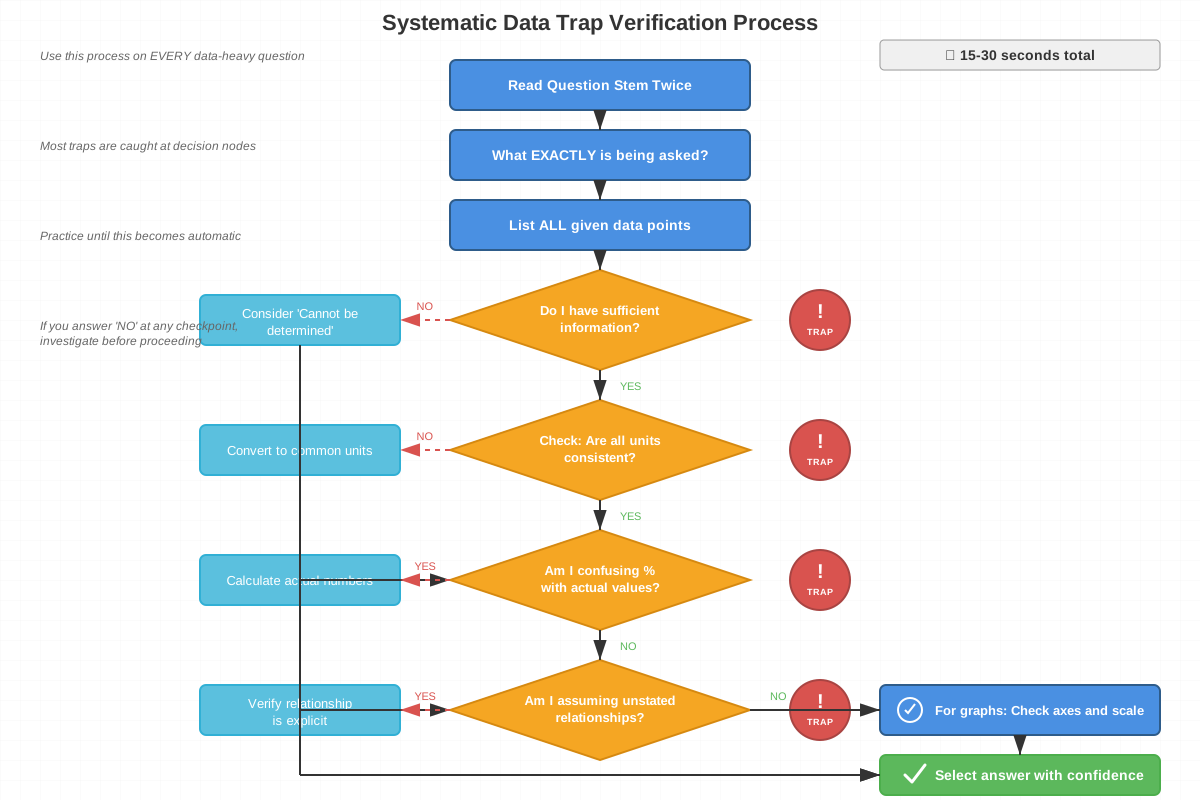
Avoiding data traps requires a disciplined approach rather than relying on intuition. The four-step verification process provides a framework:
Step 1: Identify the Actual Question - Read the question stem twice, underlining exactly what is being asked. Distinguish between "What is X?" and "What could X be?" or "Which must be true about X?"
Step 2: Catalog Available Information - List out every piece of data provided, noting units, time periods, and any constraints. Identify what information would be needed to answer the question completely.
Step 3: Check for Trap Elements - Systematically verify: Are units consistent? Is this asking for percentage or absolute value? Am I making any assumptions? Does the visual representation match the numbers?
Step 4: Validate the Answer - Before selecting, ask: "Does this answer address exactly what was asked?" and "Did I use appropriate data without making unjustified inferences?"
Common Data Trap Scenarios
Scenario A: The Percentage Change Chain - When multiple percentage changes occur sequentially, test-takers often add percentages rather than applying them multiplicatively. A 20% increase followed by a 20% decrease does NOT return to the original value—it results in a 4% net decrease.
Scenario B: The Average Trap - Questions provide information about averages and ask about totals, or vice versa, but omit the number of items. Without knowing how many data points contribute to an average, neither the total nor comparisons between groups can be determined.
Scenario C: The Rate-Time-Distance Confusion - These problems present rates for different portions of a journey and ask about average rate for the entire trip. The trap is averaging the rates rather than using total distance divided by total time.
Scenario D: The Overlapping Categories - Data about categories that may overlap (e.g., "students who play soccer" and "students who play basketball") cannot be combined or compared without information about overlap, yet questions are phrased to suggest simple addition or subtraction.
Concept Relationships
The five major trap categories interconnect through the common thread of exploiting intuitive but incorrect reasoning. Insufficient Information Traps often combine with Assumption Traps—test-takers fill information gaps with reasonable-seeming assumptions. Similarly, Unit Confusion Traps frequently appear alongside Visual Misrepresentation Traps in data interpretation questions, where graphs use different scales for different data series.
The Systematic Verification Process serves as the overarching framework that addresses all trap categories. Step 2 (Catalog Available Information) specifically counters Insufficient Information Traps, while Step 3 (Check for Trap Elements) addresses the other four categories systematically.
Relationship Map:
Trap Recognition → Triggers Systematic Verification Process → Step 1 (Identify Actual Question) → Prevents Assumption Traps → Step 2 (Catalog Information) → Reveals Insufficient Information → Step 3 (Check Trap Elements) → Catches Unit/Scale/Percentage/Visual Traps → Step 4 (Validate Answer) → Confirms answer matches actual question → Correct Response
This topic builds directly on prerequisite knowledge: percentage concepts enable recognition of Percentage vs. Absolute traps; graph interpretation skills are necessary to identify Visual Misrepresentation; algebraic reasoning helps recognize when variables lack sufficient constraints. Mastering data traps enhances performance on related topics including statistics (where data interpretation is crucial), probability (which often involves careful reading of constraints), and word problems (where assumption traps are common).
High-Yield Facts
⭐ The most common data trap involves confusing percentage change with absolute change—always identify which the question asks for before calculating.
⭐ In Quantitative Comparison questions, if you cannot determine the relationship with certainty, "Cannot be determined" is likely correct—don't make assumptions about unstated constraints.
⭐ When graphs show different scales or units for different data series, direct visual comparison is meaningless—always read actual values.
⭐ Sequential percentage changes multiply, they don't add—a 10% increase then 10% decrease yields 0.99x, not 1.00x.
⭐ "Average rate" for a journey is NOT the average of the rates—it's total distance divided by total time.
- Questions asking "which MUST be true" require certainty; "which COULD be true" requires only possibility—these demand different reasoning approaches.
- When a question provides information about overlapping categories without stating the overlap, you cannot determine combined totals.
- Percentages require a reference base—"20% more" is meaningless without knowing "more than what."
- In data interpretation sets, information from one question cannot be assumed to apply to other questions unless explicitly stated.
- Visual area in graphs (like bar width or pie slice size) should represent data proportionally, but sometimes doesn't—verify with actual numbers.
Quick check — test yourself on GRE data traps so far.
Try Flashcards →Common Misconceptions
Misconception: If a question provides specific numerical data, there must be enough information to calculate a definitive answer.
Correction: GRE questions frequently provide partial information to test whether students recognize insufficiency. Always verify that every necessary piece of data is available before attempting calculation.
Misconception: When comparing two quantities that both increased by the same percentage, the one that started larger will still be larger by the same absolute amount.
Correction: Equal percentage increases from different bases produce different absolute increases. A 50% increase from 100 (→150) adds 50, while 50% increase from 200 (→300) adds 100.
Misconception: In Quantitative Comparison questions with variables, testing one or two values is sufficient to determine the relationship.
Correction: Variables can take any real number value unless constrained. Always test extreme cases: very large numbers, very small positive numbers, zero (if allowed), negative numbers, and fractions between 0 and 1.
Misconception: If a graph shows one line rising more steeply than another, the steeper line represents larger values.
Correction: Steepness represents rate of change, not absolute magnitude. A line can rise steeply but remain below another line that rises gradually from a higher starting point.
Misconception: When a question asks about "the average" of a group, any information about individuals in that group is sufficient to calculate it.
Correction: Calculating an average requires knowing both the sum of all values AND the number of values. Information about some individuals without knowing the total count is typically insufficient.
Misconception: Data presented in a table or graph has been verified for internal consistency.
Correction: While rare, some GRE questions intentionally present data where different representations (like a table and accompanying graph) contain contradictions to test careful reading. Always work from the data source most directly relevant to the question.
Worked Examples
Example 1: Percentage vs. Absolute Trap
Question: In 2018, Company A had 200 employees and Company B had 800 employees. From 2018 to 2020, Company A's workforce increased by 40% while Company B's workforce increased by 15%. Which company added more employees?
Trap: The intuitive response is "Company A increased by a larger percentage (40% vs. 15%), so Company A added more employees."
Solution Process:
Step 1 - Identify the actual question: "Which company added more employees?" This asks for absolute increase, not percentage increase.
Step 2 - Catalog information:
- Company A: 200 employees initially, 40% increase
- Company B: 800 employees initially, 15% increase
Step 3 - Check for traps: This is a percentage vs. absolute value trap. The question asks about absolute increase but provides percentage changes.
Step 4 - Calculate:
- Company A absolute increase: 200 × 0.40 = 80 employees
- Company B absolute increase: 800 × 0.15 = 120 employees
Answer: Company B added more employees (120 vs. 80), despite having a smaller percentage increase.
Learning Objective Connection: This example demonstrates identifying when data traps are being tested (percentage vs. absolute confusion) and applying the systematic strategy to avoid the trap.
Example 2: Insufficient Information in Quantitative Comparison
Question:
Quantity A: The average (arithmetic mean) of x, y, and z
Quantity B: The median of x, y, and z

Given: x < y < z and y = 10Choices:
(A) Quantity A is greater
(B) Quantity B is greater
(C) The two quantities are equal
(D) The relationship cannot be determined
Trap: Test-takers see that y = 10 and y is the middle value, so the median is 10. They might assume the average is also 10 or try to determine which is larger.
Solution Process:
Step 1 - Identify the actual question: Compare the mean and median of three ordered values.
Step 2 - Catalog information:
- Three values in order: x < y < z
- Middle value: y = 10
- Therefore median = 10
- No information about x or z except they're less than and greater than 10, respectively
Step 3 - Check for traps: This appears to be an insufficient information trap. Can we determine the mean?
Step 4 - Test extreme cases:
- Case 1: x = 9, y = 10, z = 11 → Mean = 10, Median = 10 (Equal)
- Case 2: x = 0, y = 10, z = 20 → Mean = 10, Median = 10 (Equal)
- Case 3: x = 1, y = 10, z = 100 → Mean = 37, Median = 10 (A is greater)
- Case 4: x = -80, y = 10, z = 11 → Mean = -19.67, Median = 10 (B is greater)
Answer: (D) The relationship cannot be determined. Without knowing the actual values of x and z, we cannot determine whether the mean is greater than, less than, or equal to the median.
Learning Objective Connection: This example shows how to identify insufficient information traps and explains the core strategy of testing extreme values to reveal when a relationship cannot be determined.
Exam Strategy
Approach Framework: When encountering any GRE Quantitative question, invest 5-10 seconds in "trap detection" before beginning calculations. This small time investment prevents the much larger time cost of working through a problem incorrectly and having to restart.
Trigger Words and Phrases:
- "Must be true" vs. "could be true" → Signals assumption/inference trap; requires different levels of certainty
- "Average" or "mean" without "total" or "number of items" → Likely insufficient information trap
- "Percent increase/decrease" → Check whether question asks for percentage or absolute value
- "At this rate" or "on average" → May involve rate calculation traps
- Any question with multiple units (thousands/millions, hours/minutes, meters/kilometers) → Unit conversion trap
Process-of-Elimination Tips:
- In Quantitative Comparison, if you find even one case where Quantity A is greater and one case where Quantity B is greater, immediately select (D) without further testing
- Eliminate answer choices that require assumptions not stated in the problem
- If an answer seems "too easy" or matches your first instinct on a medium/hard question, double-check for traps before selecting
- When answer choices span a wide range, the correct answer is rarely at the extremes unless the question involves maximization/minimization
Time Allocation:
- Spend 10-15 seconds reading and re-reading the question to identify what's actually being asked
- Allocate 5 seconds to trap detection using the red flag checklist
- If you recognize a trap pattern, spend 10 seconds verifying you're avoiding it rather than rushing to calculate
- For data interpretation sets, spend 30 seconds initially studying the graph/table structure, scales, and units before attempting any questions
Exam Tip: If you're stuck between two answers, ask yourself: "Which answer requires me to make an assumption not stated in the problem?" The answer requiring assumptions is almost always wrong on the GRE.
Memory Techniques
TRAPS Acronym for the systematic checking process:
- Type: What type of value does the question ask for? (percentage, absolute, rate, average, etc.)
- Read twice: Read the question stem twice to catch exactly what's being asked
- Assumptions: What am I assuming that isn't explicitly stated?
- Provided data: Is every piece of necessary information actually provided?
- Scale and units: Are all values in consistent units and scales?
The "MUST vs. COULD" Rule: Visualize a certainty spectrum. "MUST be true" questions require 100% certainty (imagine a locked safe—it MUST open with the right combination). "COULD be true" questions require only possibility (imagine a door that COULD be unlocked—you just need one scenario where it works).
Percentage Chain Visualization: For sequential percentage changes, visualize a staircase where each step is a multiplication, not a flat path where you add. Going up 20% then down 20% doesn't return you to the same level—you end up slightly lower (0.96x).
The "Base Question" for Percentages: Before calculating any percentage, ask "Percentage OF WHAT?" This forces identification of the reference base and prevents comparison errors.
Unit Conversion Mantra: "Different units, different worlds—convert before comparing." Treat values in different units as if they're in different languages that must be translated before meaningful comparison.
Summary
GRE data traps represent systematic question design patterns that exploit common cognitive biases and hasty reasoning. The five major categories—Insufficient Information, Unit/Scale Confusion, Percentage vs. Absolute Value, Assumption/Inference, and Visual Misrepresentation—account for the vast majority of trap questions. Success requires recognizing trap indicators (such as mixed units, "cannot be determined" options, or variables without constraints) and applying a systematic verification process rather than relying on intuition. The four-step process (Identify Actual Question, Catalog Information, Check for Traps, Validate Answer) provides a framework that, when consistently applied, prevents falling into these carefully constructed traps. The key insight is that data traps test critical thinking and analytical discipline rather than computational ability—they differentiate students who carefully verify what questions actually ask from those who jump to intuitive but incorrect conclusions. Mastering this topic yields disproportionate score improvements because trap awareness is a transferable skill that enhances performance across all question types.
Key Takeaways
- Data traps appear in 15-20% of GRE Quantitative questions and represent high-yield opportunities for score improvement through pattern recognition rather than content learning
- The five major trap categories (Insufficient Information, Unit/Scale Confusion, Percentage vs. Absolute, Assumption/Inference, Visual Misrepresentation) cover nearly all trap questions
- Always distinguish between what a question asks for (percentage vs. absolute, must vs. could, average vs. total) and what intuition suggests
- Sequential percentage changes multiply rather than add; a 20% increase followed by 20% decrease yields 96% of the original, not 100%
- In Quantitative Comparison questions with variables, test extreme values including negatives, fractions, and zero to determine if the relationship can be established with certainty
- Invest 5-10 seconds in trap detection before calculating—this small time cost prevents the larger cost of working through problems incorrectly
- When answer choices seem obvious or match first instincts on medium/hard questions, this is a red flag to double-check for traps
Related Topics
Data Interpretation and Analysis: Mastering data traps provides the foundation for advanced data interpretation skills, including multi-graph analysis and complex table reading where trap elements become more sophisticated.
Statistics and Probability: These topics frequently incorporate data traps, particularly around conditional probability, sampling, and statistical inference where assumption traps are common.
Word Problem Strategies: The systematic verification process developed for data traps transfers directly to complex word problems where careful reading and assumption-checking are essential.
Quantitative Comparison Strategies: Data traps appear most frequently in QC format, and mastering trap recognition dramatically improves performance on this question type.
Advanced Percentage Problems: Building on percentage vs. absolute trap awareness enables tackling complex problems involving compound interest, population growth, and multi-step percentage changes.
Practice CTA
Now that you understand the systematic patterns behind GRE data traps, it's time to put this knowledge into practice. Attempt the practice questions designed specifically to test trap recognition and avoidance. As you work through problems, consciously apply the four-step verification process until it becomes automatic. Remember: every trap you learn to recognize is worth points on test day, and unlike content gaps, trap awareness improves quickly with deliberate practice. The flashcards will help reinforce trap indicators and checking strategies until they become second nature. Your ability to spot and avoid these traps is what will push your score from good to exceptional—start practicing now!
Sign up free to keep reading
Create a free AnvayaPrep account to finish this GRE guide on GRE data traps — plus flashcards and practice questions.