Overview
The mean, commonly known as the average, is one of the most fundamental statistical concepts tested on the GRE Quantitative Reasoning section. Understanding how to calculate, manipulate, and interpret the mean is essential for success on Data Analysis questions, which constitute approximately 25% of the quantitative section. The mean represents the central tendency of a dataset—the value around which all data points balance—and serves as a foundation for more complex statistical reasoning.
On the GRE mean questions appear in various formats: straightforward calculation problems, weighted average scenarios, questions involving changes to datasets, and problems requiring reverse-engineering from a given mean to find missing values. The GRE tests not just computational ability but conceptual understanding of how the mean behaves when data points are added, removed, or modified. Students who master mean-related concepts gain a significant advantage, as these questions often appear in both discrete quantitative comparison and problem-solving formats.
The mean connects intimately with other Data Analysis concepts including median, mode, range, and standard deviation. It serves as the baseline for understanding data distribution and variability. Additionally, mean calculations frequently integrate with other Quantitative Reasoning topics such as ratios, percentages, and algebraic manipulation, making it a high-yield topic that appears across multiple question types and difficulty levels throughout the exam.
Learning Objectives
- [ ] Identify when Mean is being tested
- [ ] Explain the core rule or strategy behind Mean
- [ ] Apply Mean to GRE-style questions accurately
- [ ] Calculate weighted means involving multiple groups or categories
- [ ] Determine missing values in a dataset when the mean is provided
- [ ] Analyze how adding, removing, or changing data points affects the mean
- [ ] Compare mean values across different datasets in quantitative comparison questions
Prerequisites
- Basic arithmetic operations: Addition, subtraction, multiplication, and division are essential for calculating means and manipulating equations involving averages
- Algebraic manipulation: Setting up and solving equations is necessary when working backward from a given mean to find unknown values
- Fractions and decimals: Many mean calculations involve non-integer values requiring comfort with fractional and decimal arithmetic
- Understanding of summation: Recognizing that the mean relates to the total sum of values divided by the count is foundational
Why This Topic Matters
The mean appears in countless real-world applications, from calculating grade point averages and understanding economic indicators to interpreting scientific data and making business decisions. In professional and academic contexts, the ability to quickly compute and interpret averages is essential for data-driven decision-making. Understanding how outliers affect the mean, how to weight different components appropriately, and how changes to datasets impact central tendency are practical skills that extend far beyond standardized testing.
On the GRE, mean-related questions appear with high frequency—typically 2-4 questions per exam directly test mean concepts, with additional questions incorporating mean as part of more complex data interpretation scenarios. These questions appear in multiple formats: as discrete quantitative problems requiring calculation, as quantitative comparison questions asking students to compare means of different datasets, and within data interpretation sets where students must extract information from tables or graphs to compute averages.
The GRE commonly tests mean through several specific question types: finding the mean of a dataset, determining how the mean changes when values are added or removed, calculating weighted averages when combining groups, solving for unknown values given a mean, and comparing means to other measures of central tendency. Questions often embed mean calculations within word problems involving test scores, prices, temperatures, speeds, or other real-world quantities, requiring students to translate verbal descriptions into mathematical operations.
Core Concepts
Definition and Basic Calculation
The mean of a dataset is calculated by summing all values and dividing by the number of values. Mathematically, for a dataset with n values:
Mean = (Sum of all values) / (Number of values)
Mean = (x₁ + x₂ + x₃ + ... + xₙ) / n
For example, to find the mean of the dataset {3, 7, 9, 12, 14}, sum the values (3 + 7 + 9 + 12 + 14 = 45) and divide by the count (5), yielding a mean of 9.
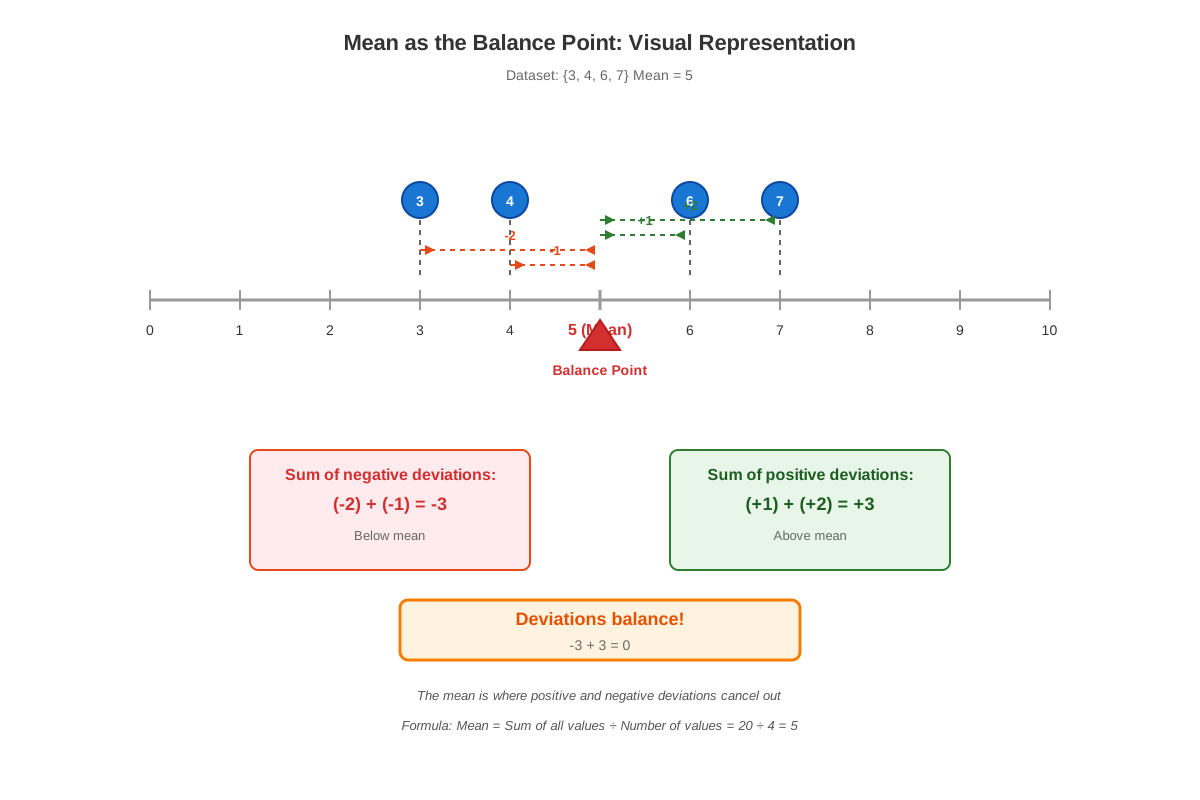
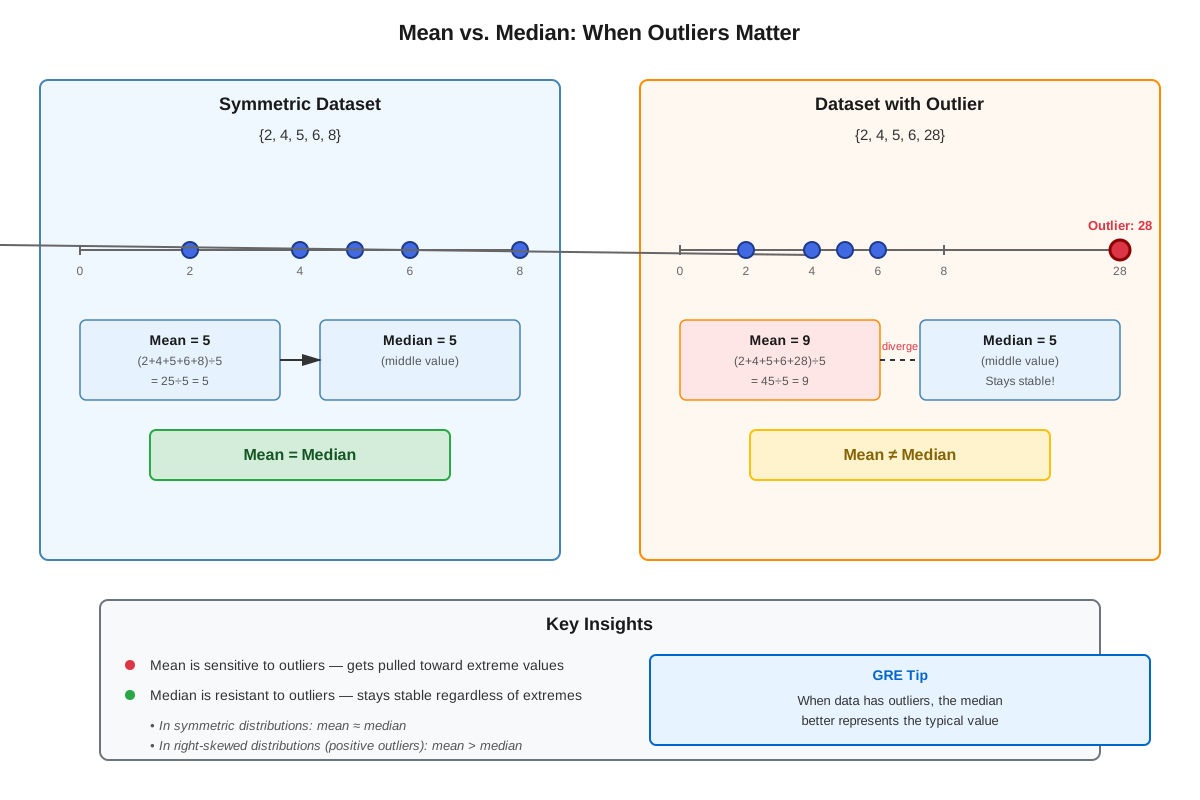
The mean can be conceptualized as the "balance point" of a dataset—if all values were placed on a number line with equal weights, the mean would be the point where the line balances perfectly. This interpretation helps explain why the mean is sensitive to extreme values: a single very large or very small value can shift the balance point significantly.
The Mean Formula Rearranged
Understanding that Mean × Number of values = Sum is crucial for GRE problem-solving. This rearrangement allows students to:
Sum = Mean × nThis form is particularly useful when working backward from a given mean to find the total sum, or when determining what value must be added to achieve a target mean. Many GRE questions provide the mean and ask students to find individual values or totals, making this rearrangement essential.
Weighted Mean
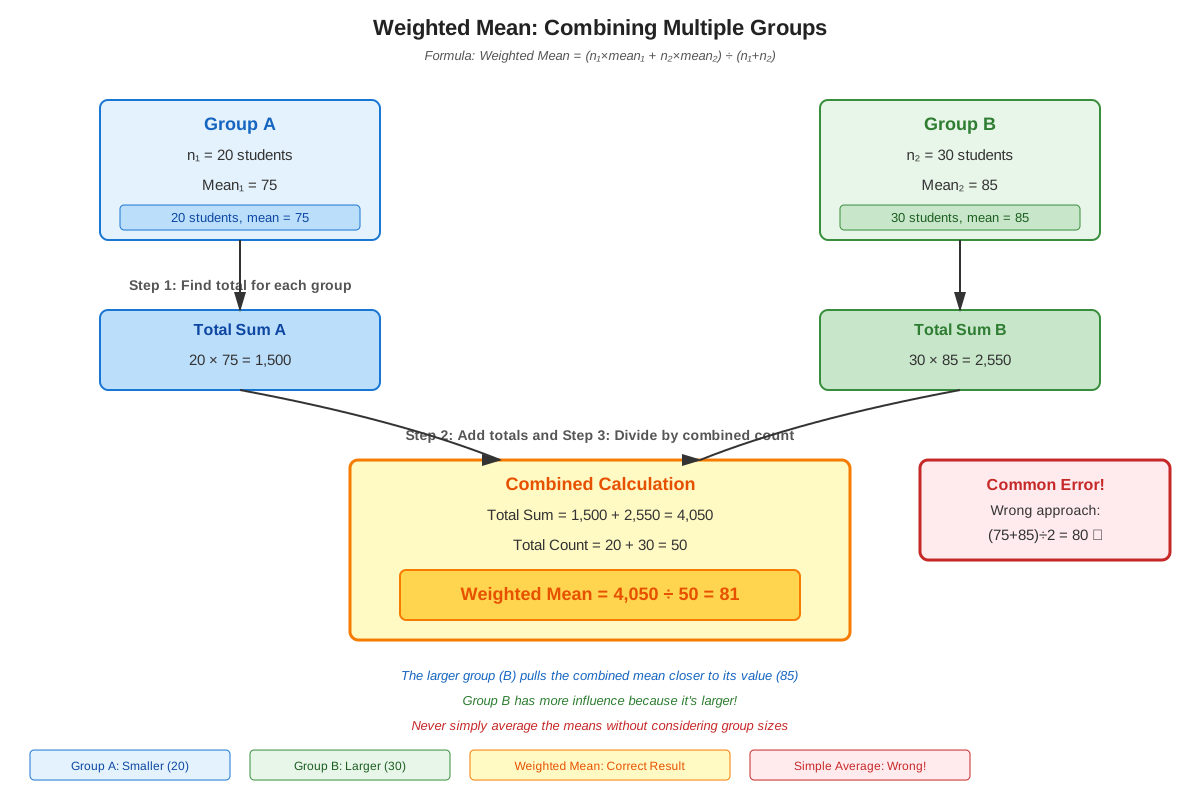
A weighted mean accounts for the fact that different values may have different levels of importance or frequency. When combining groups with different means, the overall mean is not simply the average of the individual means—it must be weighted by the size of each group.
The weighted mean formula is:
Weighted Mean = (w₁x₁ + w₂x₂ + ... + wₙxₙ) / (w₁ + w₂ + ... + wₙ)where w represents weights and x represents values.
For example, if Class A has 20 students with a mean score of 85, and Class B has 30 students with a mean score of 90, the combined mean is NOT 87.5 (the simple average of 85 and 90). Instead:
Combined Mean = (20 × 85 + 30 × 90) / (20 + 30) = (1700 + 2700) / 50 = 4400 / 50 = 88The larger class (Class B) has more influence on the combined mean, pulling it closer to 90 than to 85.
Effect of Adding or Removing Values
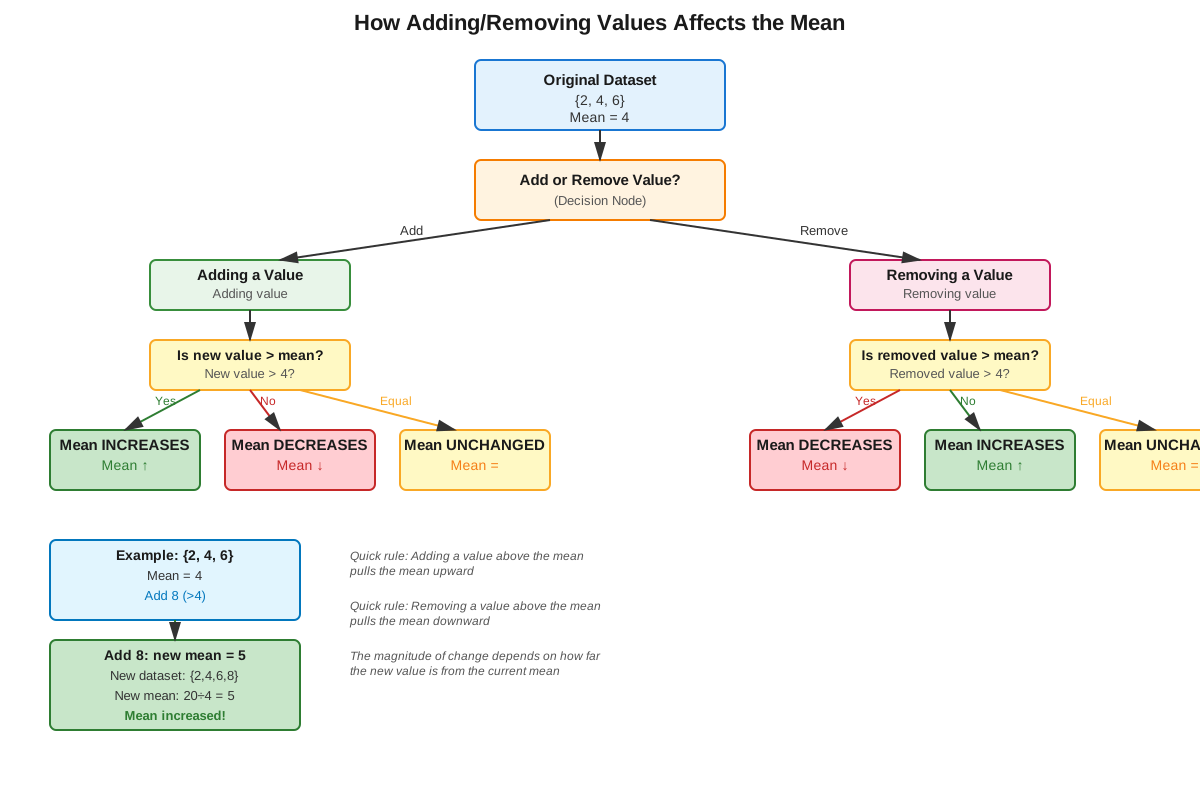
When a value is added to a dataset, the new mean can be determined by considering how the new value compares to the current mean:
- Adding a value equal to the current mean leaves the mean unchanged
- Adding a value greater than the current mean increases the mean
- Adding a value less than the current mean decreases the mean
The magnitude of change depends on both the difference between the new value and the current mean, and the size of the dataset. Larger datasets are less affected by individual additions.
To calculate the new mean precisely:
New Mean = (Old Sum + New Value) / (Old Count + 1)
New Mean = (Old Mean × Old Count + New Value) / (Old Count + 1)
Similarly, when removing a value, the mean shifts away from the removed value toward the remaining values.
Finding Missing Values
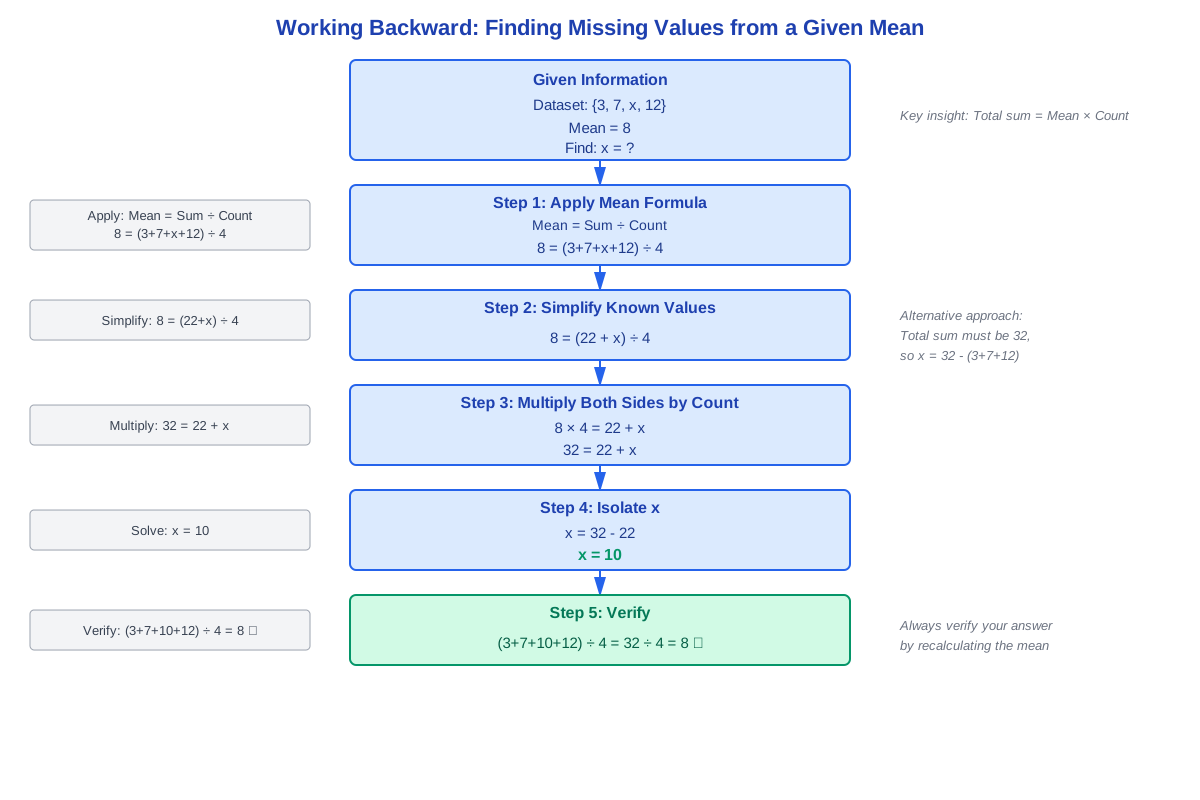
GRE questions frequently provide the mean of a dataset and ask students to find a missing value. The strategy involves:
- Calculate the required sum using: Sum = Mean × Count
- Sum the known values
- Subtract the sum of known values from the required sum to find the missing value
For example, if five test scores have a mean of 82, and four scores are 78, 85, 80, and 88, find the fifth score:
- Required sum: 82 × 5 = 410
- Sum of known scores: 78 + 85 + 80 + 88 = 331
- Missing score: 410 - 331 = 79
Mean vs. Median Comparison
Understanding when the mean differs from the median helps interpret data distributions:
| Condition | Relationship | Interpretation |
|---|---|---|
| Symmetric distribution | Mean ≈ Median | Data balanced around center |
| Right-skewed (positive skew) | Mean > Median | High outliers pull mean up |
| Left-skewed (negative skew) | Mean < Median | Low outliers pull mean down |
The GRE may present datasets and ask students to compare measures of central tendency or to recognize which measure better represents "typical" values in the presence of outliers.
Mean of Evenly Spaced Sets
For datasets with evenly spaced values (arithmetic sequences), the mean equals the median and can be calculated as:
Mean = (First value + Last value) / 2For example, the mean of {2, 5, 8, 11, 14} is (2 + 14) / 2 = 8, which is much faster than summing all five values. This shortcut applies to consecutive integers, consecutive even integers, consecutive odd integers, and any arithmetic sequence.
Concept Relationships
The mean serves as the foundation for understanding data distribution and connects to multiple statistical concepts. The relationship between mean and sum is bidirectional: knowing either the mean or the sum (along with the count) allows calculation of the other. This relationship enables the reverse-engineering strategy where students work backward from a given mean to find missing values or required totals.
Weighted mean extends the basic mean concept by incorporating the principle that not all values contribute equally to the average. This connects to proportional reasoning and ratio concepts, as weights represent the relative importance or frequency of different values. Understanding weighted means is essential for problems involving combined groups, where the overall mean depends on both the individual means and the sizes of the groups.
The effect of adding or removing values connects mean to concepts of change and comparison. This relationship helps students predict directional changes without full recalculation, saving time on quantitative comparison questions. The magnitude of change relates to both the deviation from the current mean and the dataset size, connecting to concepts of relative impact and proportional change.
Mean versus median comparisons connect to data distribution and outlier effects. This relationship helps students understand when the mean accurately represents typical values and when it may be misleading. The comparison also connects to number line visualization and symmetry concepts, as the relative positions of mean and median indicate distribution shape.
Relationship map: Basic Mean Calculation → Sum-Mean-Count Triangle → Weighted Mean (incorporating group sizes) → Effect of Changes (adding/removing values) → Missing Value Problems (reverse engineering) → Mean-Median Comparison (distribution analysis)
Quick check — test yourself on Mean so far.
Try Flashcards →High-Yield Facts
⭐ The mean equals the sum of all values divided by the number of values: This fundamental formula is the basis for all mean calculations and manipulations
⭐ Sum = Mean × Count: This rearrangement is essential for working backward from a given mean to find totals or missing values
⭐ When combining groups, the overall mean is weighted by group sizes: Simply averaging the individual means is incorrect unless groups are equal in size
⭐ Adding a value equal to the current mean leaves the mean unchanged: This principle helps predict the effect of adding values without full recalculation
⭐ For evenly spaced values, the mean equals (first + last) / 2: This shortcut dramatically speeds up calculations for arithmetic sequences
- The mean is sensitive to outliers and extreme values, unlike the median which is resistant to extremes
- When all values in a dataset increase by the same amount, the mean increases by that same amount
- When all values in a dataset are multiplied by the same factor, the mean is multiplied by that same factor
- The mean of a dataset can be a non-integer even when all values are integers
- In a symmetric distribution, the mean and median are equal; in a right-skewed distribution, the mean exceeds the median
- The mean of means equals the overall mean only when all groups have equal sizes
- Zero values in a dataset must be included in the count when calculating the mean
Common Misconceptions
Misconception: When combining two groups, the overall mean is the average of the two individual means.
Correction: The overall mean must be weighted by the sizes of the groups. Only when groups are equal in size does the overall mean equal the simple average of the individual means. Use the formula: Combined Mean = (Sum₁ + Sum₂) / (Count₁ + Count₂).
Misconception: Adding a value to a dataset always increases the mean.
Correction: The mean increases only if the added value is greater than the current mean. Adding a value less than the current mean decreases the mean, and adding a value equal to the current mean leaves it unchanged.
Misconception: The mean must be one of the values in the dataset.
Correction: The mean represents the balance point of all values and frequently falls between data points rather than on an actual value. For example, the mean of {1, 2, 3} is 2, but the mean of {1, 2, 4} is 2.33, which is not in the dataset.
Misconception: Removing the largest value from a dataset always decreases the mean by a predictable amount.
Correction: While removing the largest value does decrease the mean, the amount of decrease depends on both how much larger that value is compared to the mean and the size of the remaining dataset. The calculation requires finding the new sum and dividing by the new count.
Misconception: If Dataset A has a higher mean than Dataset B, every value in Dataset A must be greater than every value in Dataset B.
Correction: Means represent central tendency, not individual values. Dataset A could have a higher mean than Dataset B while still containing some values lower than some values in Dataset B. For example, {1, 10} has a mean of 5.5, while {4, 5, 6} has a mean of 5, yet Dataset B contains values greater than 1 from Dataset A.
Misconception: The mean is always the best measure of central tendency.
Correction: The mean is sensitive to outliers and may not represent typical values in skewed distributions. In such cases, the median often provides a better representation of the center. The choice of measure depends on the distribution and the question being asked.
Worked Examples
Example 1: Finding a Missing Value
Problem: A student takes five tests during a semester. The mean score for all five tests is 84. If the scores on the first four tests are 78, 82, 88, and 85, what score must the student earn on the fifth test?
Solution:
Step 1: Identify what we know and what we need to find.
- Mean of 5 tests = 84
- Four known scores: 78, 82, 88, 85
- Unknown: fifth test score
Step 2: Use the relationship Sum = Mean × Count to find the required total.
- Required sum = 84 × 5 = 420
Step 3: Calculate the sum of the known scores.
- Sum of known scores = 78 + 82 + 88 + 85 = 333
Step 4: Find the missing score by subtraction.
- Fifth test score = 420 - 333 = 87
Answer: The student must score 87 on the fifth test.
Connection to Learning Objectives: This problem demonstrates applying mean to GRE-style questions by using the core strategy of rearranging the mean formula to work backward from a given mean to find a missing value.
Example 2: Weighted Mean with Combined Groups
Problem: Section A of a statistics course has 25 students with a mean exam score of 78. Section B has 35 students with a mean exam score of 86. What is the mean exam score for all students in both sections combined?
Solution:
Step 1: Recognize this is a weighted mean problem—we cannot simply average 78 and 86.
Step 2: Calculate the total points for each section using Sum = Mean × Count.
- Section A total: 78 × 25 = 1,950 points
- Section B total: 86 × 35 = 3,010 points
Step 3: Find the combined total and combined count.
- Combined total: 1,950 + 3,010 = 4,960 points
- Combined count: 25 + 35 = 60 students
Step 4: Calculate the combined mean.
- Combined mean = 4,960 / 60 = 82.67 (or 82⅔)
Answer: The mean exam score for all students is approximately 82.67.
Verification: Notice that the combined mean (82.67) is closer to Section B's mean (86) than to Section A's mean (78) because Section B has more students. This makes intuitive sense and serves as a check on our calculation.
Connection to Learning Objectives: This problem illustrates the core strategy for weighted means and demonstrates how to identify when mean is being tested in a context involving combined groups.
Exam Strategy
When approaching GRE mean questions, first identify the question type by recognizing key patterns. Questions asking for "the average," "the mean," or "the arithmetic mean" directly signal mean calculations. Questions about "combining groups," "overall average," or "all students together" indicate weighted mean problems. Phrases like "what score is needed" or "what value must be added" suggest missing value problems requiring reverse engineering.
Trigger words and phrases to watch for include: average, mean, arithmetic mean, per (as in "dollars per item"), evenly distributed, combined, overall, and typical. Questions using quantitative comparison format often ask students to compare means of different datasets or to compare a mean to a specific value, requiring quick estimation rather than precise calculation.
Process-of-elimination strategies specific to mean questions:
- Boundary checking: The mean must fall between the minimum and maximum values in the dataset. Eliminate any answer choices outside this range.
- Weighted mean positioning: When combining groups, the overall mean must fall between the individual means, closer to the mean of the larger group. Eliminate choices that violate this principle.
- Effect direction: When adding a value to a dataset, determine whether it's above or below the current mean to predict whether the new mean increases or decreases. Eliminate choices showing the wrong direction of change.
- Integer vs. non-integer: Recognize that means can be non-integers even when all data values are integers. Don't automatically eliminate decimal answers.
For quantitative comparison questions involving means, often estimation suffices rather than precise calculation. Determine which dataset has a higher sum and whether the counts are equal. If Dataset A has both a higher sum and fewer values, its mean is definitely higher. If one dataset has a higher sum but also more values, more careful analysis is needed.
Time allocation: Simple mean calculations should take 30-45 seconds. Weighted mean problems typically require 60-90 seconds. Complex problems involving multiple steps or reverse engineering may take up to 2 minutes. If a problem requires more time, mark it for review and move on, returning if time permits.
Calculation efficiency tips: For evenly spaced values, use the (first + last) / 2 shortcut. When combining groups, set up the calculation systematically: find each group's total, add the totals, add the counts, then divide. For missing value problems, always use the Sum = Mean × Count relationship rather than trying to work with the mean directly.
Memory Techniques
Mnemonic for the Mean Formula Triangle: "Susan Makes Cookies" represents Sum = Mean × Count. Visualize a triangle with Sum at the top, Mean and Count at the bottom corners. Cover any one corner to see the formula for finding it: cover Sum to see Mean × Count, cover Mean to see Sum ÷ Count, cover Count to see Sum ÷ Mean.
Visualization for Weighted Means: Picture a seesaw or balance scale. The larger group is a heavier weight, pulling the combined mean closer to its value. This mental image helps remember that the overall mean is weighted toward the larger group, not simply the midpoint between the two means.
Acronym for Effect of Adding Values: "ELU" - Equal (mean stays same), Less (mean decreases), Up (mean increases). When adding a value, compare it to the current mean: Equal to mean → no change, Less than mean → mean decreases, Up from mean (greater) → mean increases.
Memory phrase for Evenly Spaced Sets: "First and Last, Fast" - For evenly spaced values, use (First + Last) / 2 for a fast calculation of the mean.
Visualization for Mean vs. Median: Picture a number line with data points as physical objects. The mean is where the line would balance if placed on a fulcrum (sensitive to outliers pulling it), while the median is simply the middle position (resistant to outliers). This helps remember why extreme values affect the mean more than the median.
Summary
The mean, or average, is a fundamental measure of central tendency calculated by dividing the sum of all values by the count of values. Mastery of mean concepts requires understanding not just basic calculation but also the bidirectional relationship between sum, mean, and count (Sum = Mean × Count), which enables working backward to find missing values. Weighted means account for different group sizes when combining datasets, with the overall mean positioned closer to the mean of the larger group. Adding values to a dataset shifts the mean toward those values: adding a value above the mean increases it, below decreases it, and equal to it leaves it unchanged. For evenly spaced values, the shortcut (first + last) / 2 provides rapid calculation. The mean differs from the median in its sensitivity to outliers, with their relative positions indicating distribution shape. GRE questions test these concepts through direct calculation, weighted averages, missing value problems, effect of changes, and quantitative comparisons, making mean one of the highest-yield topics in Data Analysis.
Key Takeaways
- The mean equals the sum divided by the count, but rearranging to Sum = Mean × Count is essential for reverse-engineering problems
- Weighted means require accounting for group sizes; simply averaging individual means is incorrect unless groups are equal
- Adding a value above the current mean increases it, below decreases it, and equal to it leaves it unchanged
- For evenly spaced values (arithmetic sequences), use the shortcut: Mean = (First + Last) / 2
- The mean is sensitive to outliers while the median is resistant; in right-skewed distributions, mean > median
- When combining groups, the overall mean falls between the individual means, weighted toward the larger group
- Most GRE mean problems test conceptual understanding and manipulation rather than just computational ability
Related Topics
Median and Mode: These alternative measures of central tendency complement the mean, with median representing the middle value and mode the most frequent value. Understanding when each measure is most appropriate deepens statistical reasoning.
Standard Deviation and Variance: These measures of spread quantify how data points deviate from the mean, building directly on mean concepts to describe data distribution more completely.
Weighted Averages in Context: Applications including grade point averages, investment returns, and mixture problems extend weighted mean concepts to complex real-world scenarios.
Data Interpretation: Tables, graphs, and charts often require calculating or comparing means as part of multi-step analysis, integrating mean concepts with visual data representation.
Probability and Expected Value: Expected value in probability is calculated as a weighted mean of outcomes, connecting statistical and probabilistic reasoning.
Practice CTA
Now that you've mastered the core concepts, formulas, and strategies for mean problems, it's time to solidify your understanding through active practice. Attempt the practice questions to apply these concepts to GRE-style problems, and use the flashcards to reinforce key formulas and relationships. Remember, the difference between understanding mean conceptually and executing perfectly under timed conditions comes from deliberate practice. Each problem you solve strengthens your pattern recognition and calculation speed, bringing you closer to your target score. Start practicing now to transform this knowledge into test-day confidence!
Sign up free to keep reading
Create a free AnvayaPrep account to finish this GRE guide on Mean — plus flashcards and practice questions.