Overview
Quantitative comparison data questions represent a unique and challenging question format on the GRE that combines data interpretation with the distinctive quantitative comparison structure. Unlike traditional problem-solving questions that ask for a specific numerical answer, these questions present two quantities (Quantity A and Quantity B) derived from data sets, charts, graphs, or tables, and require test-takers to determine the relationship between them. This hybrid format demands both analytical reasoning skills and the ability to extract relevant information efficiently from visual or tabular data presentations.
Mastering GRE quantitative comparison data questions is essential because they appear frequently throughout the Quantitative Reasoning section and test multiple skills simultaneously. These questions assess not only mathematical computation but also data literacy, logical reasoning, and the ability to make comparisons without necessarily calculating exact values. The format rewards strategic thinking—often, determining which quantity is larger requires estimation, pattern recognition, or conceptual understanding rather than complete calculation. This efficiency-focused approach aligns perfectly with the time constraints of the GRE, where spending too long on any single question can compromise overall performance.
Within the broader landscape of Quantitative Reasoning, quantitative comparison data questions bridge multiple content areas. They integrate statistical concepts like mean, median, and range with the strategic decision-making required for standard quantitative comparison questions. They also connect to data interpretation skills used in graph analysis and table reading, while maintaining the four-answer-choice structure unique to quantitative comparisons (A: Quantity A is greater; B: Quantity B is greater; C: The two quantities are equal; D: The relationship cannot be determined). Understanding how to navigate this intersection of skills is crucial for achieving a competitive GRE score.
Learning Objectives
- [ ] Identify when Quantitative comparison data questions is being tested
- [ ] Explain the core rule or strategy behind Quantitative comparison data questions
- [ ] Apply Quantitative comparison data questions to GRE-style questions accurately
- [ ] Distinguish between situations requiring full calculation versus strategic estimation
- [ ] Recognize when insufficient information makes the relationship indeterminate (Choice D)
- [ ] Extract only relevant data from complex charts and tables to compare quantities efficiently
- [ ] Apply data analysis concepts (mean, median, percent change, ratios) within the quantitative comparison format
Prerequisites
- Basic quantitative comparison format: Understanding the four answer choices (A, B, C, D) and what each represents is fundamental to approaching these hybrid questions
- Data interpretation skills: Ability to read bar graphs, line graphs, pie charts, and tables accurately ensures correct extraction of values needed for comparison
- Fundamental statistics: Knowledge of mean, median, mode, range, and percentages enables proper interpretation of the quantities being compared
- Algebraic reasoning: Facility with variables, inequalities, and algebraic manipulation helps determine relationships without always computing exact values
- Arithmetic operations: Proficiency with fractions, decimals, percentages, and ratios allows for quick mental calculations and estimations
Why This Topic Matters
Quantitative comparison data questions appear with high frequency on the GRE Quantitative Reasoning section, typically comprising 15-20% of all quantitative questions. This translates to approximately 3-5 questions per test administration, making them too significant to ignore in any comprehensive preparation strategy. The Educational Testing Service (ETS) deliberately includes these questions because they efficiently assess multiple competencies: data literacy (increasingly important in graduate education), quantitative reasoning, and strategic problem-solving under time pressure.
In real-world applications, the skills tested by these questions mirror the analytical demands of graduate-level research and professional work. Researchers constantly compare data sets to draw conclusions, business analysts evaluate metrics to make recommendations, and scientists interpret experimental results by comparing control and treatment groups. The ability to quickly assess relationships between quantities without exhaustive calculation is a hallmark of quantitative fluency that extends far beyond standardized testing.
On the GRE, these questions commonly appear in several formats: comparing statistical measures (mean of Dataset A versus median of Dataset B), comparing values across different categories in a chart (sales in Region 1 versus Region 2), evaluating percent changes or ratios derived from tabular data, or comparing calculated values that require extracting multiple data points. The questions may present data in bar graphs, line graphs, pie charts, two-way tables, or even scatter plots. Recognizing the question type immediately allows test-takers to activate the appropriate strategic approach, saving valuable time and reducing errors.
Core Concepts
The Quantitative Comparison Framework with Data
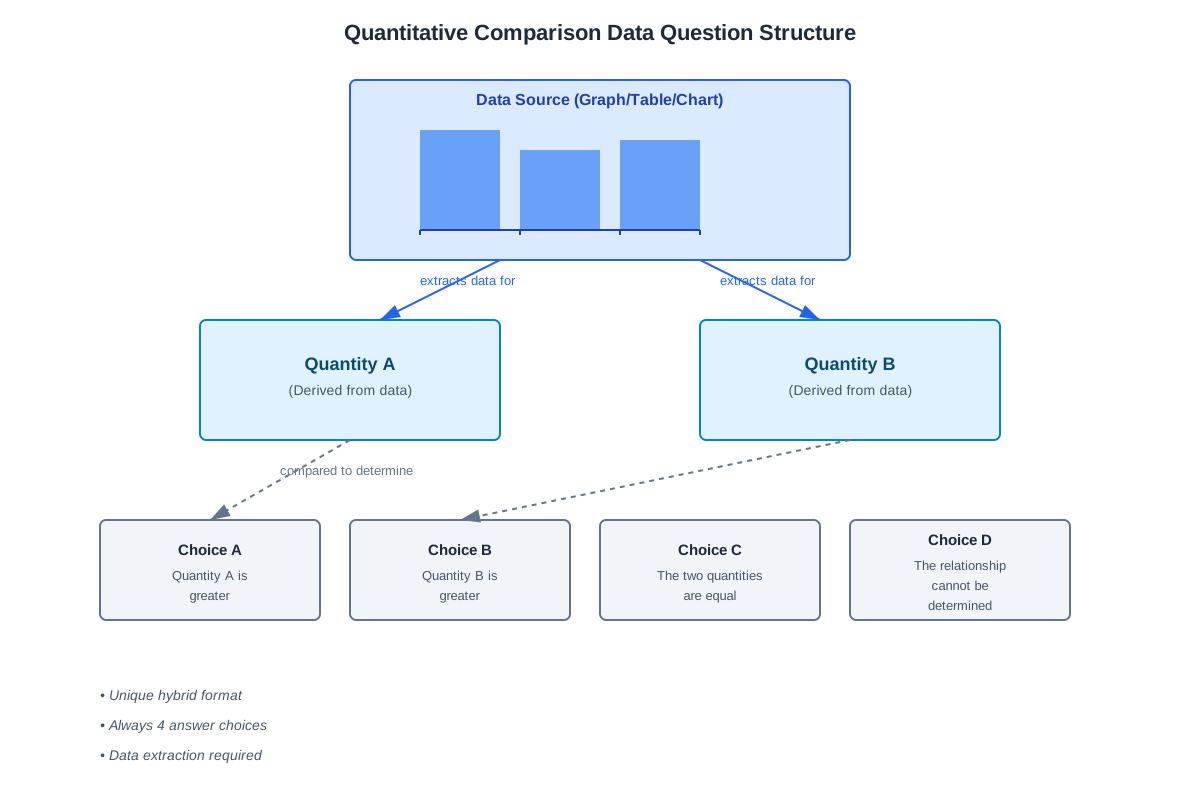
The foundation of quantitative comparison data questions rests on understanding the standard quantitative comparison structure while adding the complexity of data interpretation. Every question presents:
- A data source (graph, table, chart, or text-based data set)
- Quantity A: An expression or value derived from the data
- Quantity B: Another expression or value derived from the data
- Four answer choices that never change:
- (A) Quantity A is greater
- (B) Quantity B is greater
- (C) The two quantities are equal
- (D) The relationship cannot be determined from the information given
The critical distinction from standard quantitative comparisons is that both quantities require extracting information from a shared data source. This means test-takers must first accurately read the data, then perform any necessary calculations or comparisons, and finally determine the relationship.
Data Extraction and Relevance Filtering
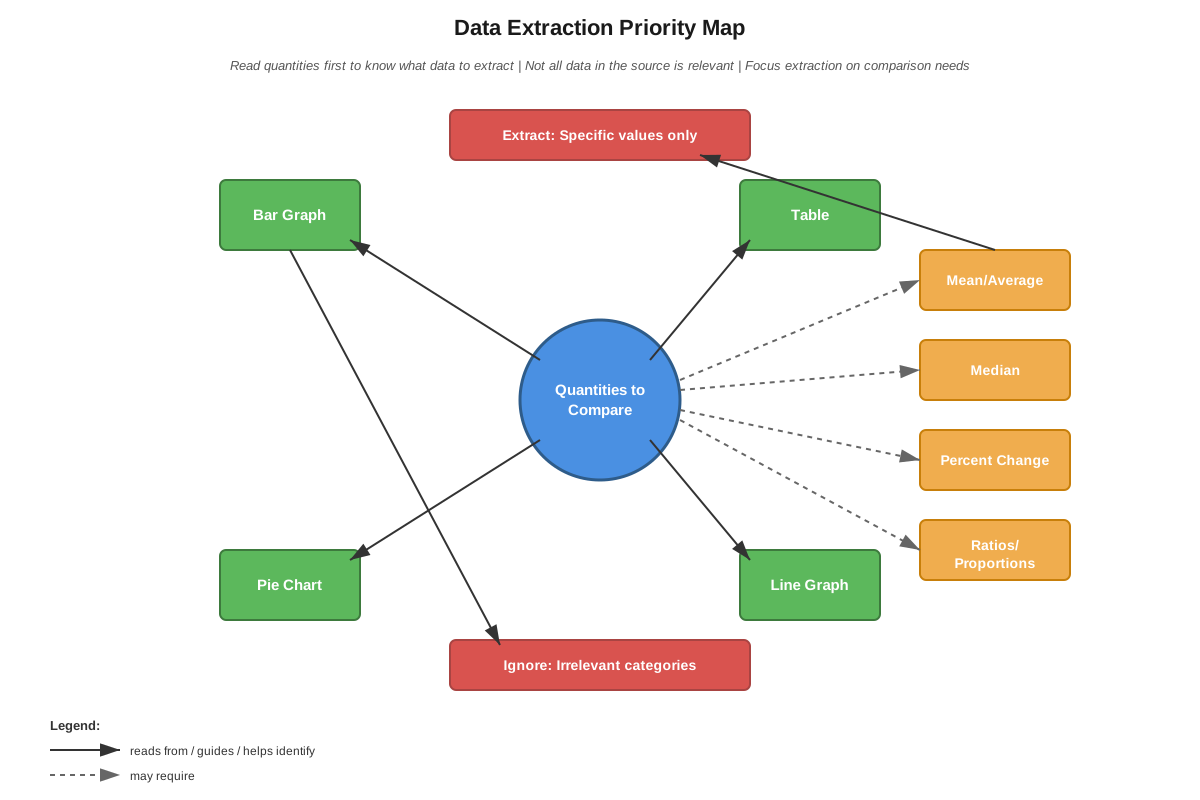
A key skill in these questions is identifying which data points are relevant to the comparison. Complex charts may contain multiple variables, time periods, or categories, but typically only a subset matters for any given question. The strategic approach involves:
- Reading the quantities first before examining the data in detail
- Identifying exactly what values are needed from the data source
- Ignoring extraneous information that doesn't affect the comparison
- Noting units and scales to avoid misreading values
For example, if Quantity A asks for "the median salary in 2020" and Quantity B asks for "the mean salary in 2020," a table showing salaries from 2015-2025 requires focusing only on the 2020 column, and a graph showing both salaries and benefits requires focusing only on the salary data.
Strategic Comparison Without Full Calculation
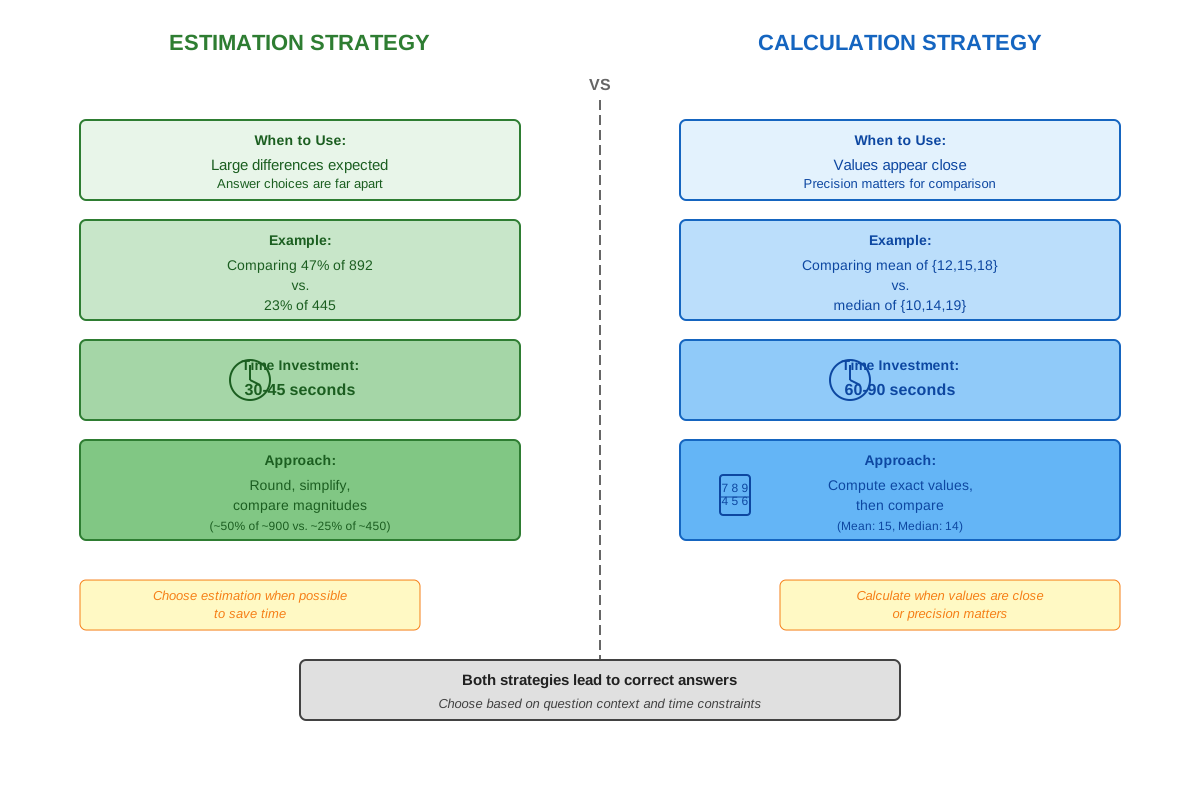
One of the most powerful strategies for GRE quantitative comparison data questions is recognizing when comparison is possible without computing exact values. This approach saves time and reduces calculation errors. Key techniques include:
| Strategy | When to Use | Example |
|---|---|---|
| Estimation | When rough values clearly show which is larger | Comparing 47% of 892 versus 23% of 1,205—estimate as ~420 versus ~277 |
| Benchmark comparison | When both quantities relate to a common reference point | If both are percentages of the same total, compare the percentages directly |
| Relative magnitude | When the scale difference is obvious | Comparing thousands versus millions |
| Algebraic manipulation | When variables are involved | If Quantity A = 2x + 5 and Quantity B = 2x + 3, subtract 2x from both |
Recognizing Choice D Scenarios
Choice D ("The relationship cannot be determined") is unique to quantitative comparison questions and represents a common trap in data-based versions. This answer is correct when:
- Insufficient data is provided: The data source doesn't contain the information needed to determine one or both quantities
- Variable relationships exist: The quantities depend on unknown variables that could take different values
- Multiple interpretations are possible: Ambiguity in the question or data allows for different valid readings
However, Choice D is often incorrectly selected by test-takers who simply find the question difficult. A critical rule: if you can calculate both quantities to specific numerical values, Choice D is never correct. The relationship can always be determined when both quantities are fixed numbers.
Common Data Presentations and Their Challenges
Different data formats present distinct challenges:
Bar Graphs and Column Charts: Require careful attention to scale, axis labels, and legend. Common errors include misreading the scale (especially when it doesn't start at zero) or confusing different categories.
Line Graphs: Demand attention to trends over time, intersection points, and rate of change. Comparisons might involve slopes (rates of change) rather than absolute values.
Pie Charts: Necessitate understanding percentages and their relationship to the whole. Calculations often require finding the actual value from a percentage when the total is given.
Tables: Present the most information density and require careful row/column navigation. Two-way tables are particularly common and demand attention to which dimension is being compared.
Scatter Plots: Less common but may appear in higher-difficulty questions, requiring understanding of correlation, outliers, and trend lines.
Statistical Measures in Comparisons
Many quantitative comparison data questions involve comparing statistical measures:
- Mean (average): Sum of values divided by count; sensitive to outliers
- Median: Middle value when ordered; resistant to outliers
- Mode: Most frequent value; may not exist or may be multiple values
- Range: Difference between maximum and minimum values
- Percent change: (New - Old) / Old × 100%
Understanding the properties of these measures enables strategic comparisons. For instance, in a right-skewed distribution, the mean is typically greater than the median, allowing immediate comparison without calculation in some cases.
The Comparison Decision Tree
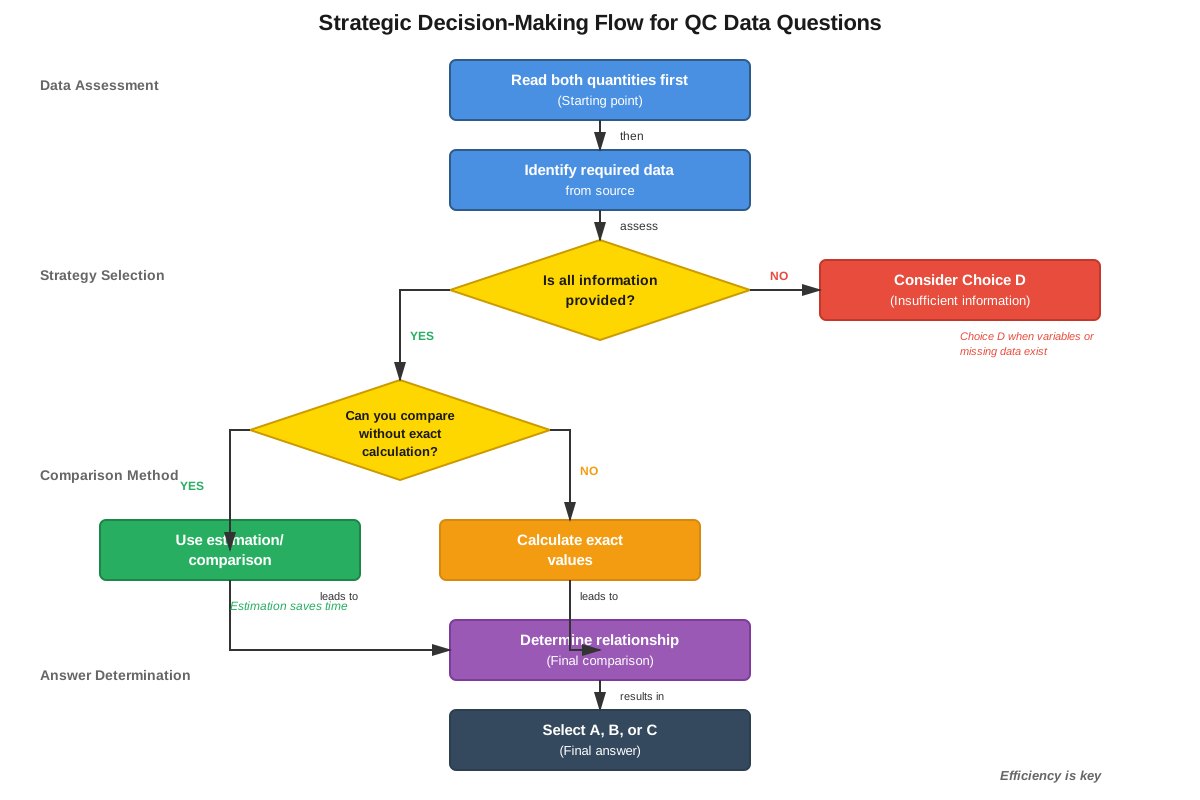
When approaching these questions, follow this systematic process:
- Read both quantities to understand what's being compared
- Examine the data source to locate relevant information
- Determine if estimation suffices or if calculation is necessary
- Check for Choice D conditions: Is all necessary information present?
- Perform minimal calculation needed to establish the relationship
- Verify the answer by checking if the opposite could be true
This structured approach prevents common errors like misreading data, performing unnecessary calculations, or overlooking the possibility that the relationship cannot be determined.
Concept Relationships
The concepts within quantitative comparison data questions form an interconnected system where each element supports the others. Data extraction and relevance filtering serves as the foundation, enabling all subsequent analysis. This skill directly feeds into strategic comparison without full calculation, because identifying the right data points makes it possible to estimate or compare conceptually rather than computing exact values.
The quantitative comparison framework provides the structural container for all other concepts—understanding the four answer choices and what each means is prerequisite to applying any strategy. This framework connects bidirectionally with recognizing Choice D scenarios, as the unique nature of quantitative comparison questions makes the "cannot be determined" option both a strategic consideration and a potential trap.
Statistical measures in comparisons represents specialized content knowledge that integrates with common data presentations, since different chart types naturally lend themselves to different statistical calculations. For example, line graphs often involve comparing rates of change (slopes), while tables frequently present data suitable for mean or median calculations.
The comparison decision tree serves as the integrative meta-strategy, incorporating all other concepts into a systematic approach. It begins with data extraction, considers whether Choice D applies, determines if strategic comparison is possible, and applies relevant statistical knowledge as needed.
Relationship to prerequisites: The topic builds directly on basic quantitative comparison format by adding the data interpretation layer, and relies heavily on fundamental statistics to define what's being compared. Data interpretation skills from prerequisite knowledge become the primary input mechanism for these questions.
Conceptual flow: Data Source → Extract Relevant Information → Identify Comparison Type → Apply Strategic Approach → Determine Relationship → Select Answer Choice
High-Yield Facts
⭐ Quantitative comparison data questions always use the same four answer choices: (A) Quantity A is greater, (B) Quantity B is greater, (C) The two quantities are equal, (D) The relationship cannot be determined
⭐ If both quantities can be calculated to specific numbers, Choice D is never correct—the relationship can always be determined between two fixed values
⭐ Read the quantities before studying the data in detail to identify exactly what information is needed and avoid wasting time on irrelevant data
⭐ Estimation often suffices to determine which quantity is greater without performing complete calculations, saving valuable time
⭐ Pay careful attention to units, scales, and labels in data presentations, as misreading these is the most common source of errors
- The mean is always greater than the median in right-skewed distributions and less than the median in left-skewed distributions
- When comparing percentages of different totals, you must calculate actual values unless the question specifically asks about the percentages themselves
- Bar graphs with scales that don't start at zero can create visual distortions that mislead quick visual comparisons
- Percent change and percent difference are distinct concepts: percent change has a directional reference point (old value), while percent difference is relative to an average or base
- In tables with multiple rows and columns, carefully track which dimension (row or column) corresponds to each quantity to avoid transposition errors
Quick check — test yourself on Quantitative comparison data questions so far.
Try Flashcards →Common Misconceptions
Misconception: Choice D should be selected whenever the question seems difficult or confusing.
Correction: Choice D is only correct when insufficient information exists to determine the relationship or when variable values could change the answer. If both quantities can be calculated to specific numbers from the given data, one of A, B, or C must be correct.
Misconception: Visual comparison of bar heights or line positions is sufficient to determine which quantity is greater.
Correction: Always check the scale and axis labels carefully. A bar that appears twice as tall may represent a value only 10% larger if the scale doesn't start at zero or uses non-linear increments.
Misconception: All data in the chart or table must be used to answer the question.
Correction: Most data presentations contain more information than needed for any single question. Strategic test-takers identify only the relevant data points required for the specific quantities being compared.
Misconception: Calculating exact values is always necessary to determine the relationship.
Correction: Many questions can be answered through estimation, conceptual understanding, or algebraic reasoning without computing precise numbers. This strategic approach saves time and reduces calculation errors.
Misconception: The mean and median of a data set are usually approximately equal.
Correction: The mean and median are only equal in perfectly symmetric distributions. In real-world data (which the GRE often presents), distributions are frequently skewed, making mean and median substantially different.
Misconception: Percent change and absolute change convey the same information.
Correction: A small absolute change can represent a large percent change if the original value is small, and vice versa. Always distinguish between these measures and use the one specified in the question.
Worked Examples
Example 1: Comparing Statistical Measures from a Table
Data Presentation: A table shows the number of books sold by a bookstore each day for one week:
| Day | Books Sold |
|---|---|
| Monday | 45 |
| Tuesday | 52 |
| Wednesday | 38 |
| Thursday | 61 |
| Friday | 55 |
| Saturday | 72 |
| Sunday | 49 |
Quantity A: The median number of books sold per day
Quantity B: The mean number of books sold per day
Solution Process:
Step 1: Identify what's needed
- Quantity A requires finding the median (middle value when ordered)
- Quantity B requires finding the mean (average)
Step 2: Calculate Quantity A (Median)
- Order the values: 38, 45, 49, 52, 55, 61, 72
- With 7 values, the median is the 4th value: 52
Step 3: Calculate Quantity B (Mean)
- Sum: 45 + 52 + 38 + 61 + 55 + 72 + 49 = 372
- Mean: 372 ÷ 7 = 53.14...
Step 4: Compare
- Quantity A = 52
- Quantity B ≈ 53.14
- Quantity B is greater
Answer: (B)
Connection to Learning Objectives: This example demonstrates applying quantitative comparison data questions to GRE-style questions accurately, specifically requiring extraction of data from a table and calculation of statistical measures. It also illustrates the core strategy of performing only necessary calculations—both values needed to be computed to determine the relationship.
Example 2: Strategic Comparison Using Percent Change
Data Presentation: A bar graph shows Company X's revenue in 2019 was $2.4 million and in 2020 was $3.0 million. Company Y's revenue in 2019 was $5.0 million and in 2020 was $6.0 million.
Quantity A: The percent increase in Company X's revenue from 2019 to 2020
Quantity B: The percent increase in Company Y's revenue from 2019 to 2020
Solution Process:
Step 1: Identify the comparison type
- Both quantities involve percent change, not absolute change
- Formula: Percent change = (New - Old) / Old × 100%
Step 2: Strategic analysis before calculation
- Company X: Increased from 2.4 to 3.0 (increase of 0.6)
- Company Y: Increased from 5.0 to 6.0 (increase of 1.0)
- Although Company Y's absolute increase is larger, percent change depends on the base value
Step 3: Calculate Quantity A
- Percent change = (3.0 - 2.4) / 2.4 × 100%
- = 0.6 / 2.4 × 100%
- = 0.25 × 100% = 25%
Step 4: Calculate Quantity B
- Percent change = (6.0 - 5.0) / 5.0 × 100%
- = 1.0 / 5.0 × 100%
- = 0.20 × 100% = 20%
Step 5: Compare
- Quantity A = 25%
- Quantity B = 20%
- Quantity A is greater
Answer: (A)
Alternative Strategic Approach (estimation without full calculation):
- Company X increased by 0.6 on a base of 2.4, which is 0.6/2.4 = 1/4 = 25%
- Company Y increased by 1.0 on a base of 5.0, which is 1.0/5.0 = 1/5 = 20%
- Since 1/4 > 1/5, Quantity A is greater
Connection to Learning Objectives: This example illustrates distinguishing between situations requiring full calculation versus strategic estimation. It also demonstrates the core rule that percent change depends on the base value, not just the absolute change—a concept frequently tested in GRE quantitative comparison data questions.
Exam Strategy
When approaching quantitative comparison data questions on the GRE, implement a systematic strategy that maximizes accuracy while managing time effectively. Begin by reading both quantities before examining the data source. This crucial first step focuses attention on exactly what information is needed, preventing the common error of getting lost in irrelevant data. Many test-takers waste precious seconds analyzing every aspect of a complex chart when only two specific values are required.
Trigger words and phrases that signal these questions include: "based on the graph/table/chart above," "according to the data," "using the information provided," and any question that presents visual data followed by two quantities to compare. When you see these signals, immediately activate your data-extraction mindset and prepare to filter for relevance.
Process-of-elimination strategies specific to this question type:
- Eliminate Choice D first if you can calculate both quantities to specific numbers. This immediately narrows options to A, B, or C.
- Check for obvious magnitude differences that allow elimination without calculation. If Quantity A is clearly in the thousands and Quantity B is clearly in the hundreds, you can eliminate B and C without computing exact values.
- Look for conceptual relationships that determine the answer. For example, if Quantity A is "the range of the data set" and Quantity B is "the maximum value in the data set," you know the range must be less than or equal to the maximum (eliminating A), and could be equal only if the minimum is zero.
- Verify your answer by testing the opposite. If you think A is correct, quickly check whether B could possibly be correct given the data. This catches reading errors and calculation mistakes.
Time allocation advice: Quantitative comparison questions should generally take 1.5-2 minutes each, slightly less than the average for problem-solving questions. The data interpretation component adds time, but the comparison format often allows strategic shortcuts that compensate. If you find yourself spending more than 2.5 minutes on a quantitative comparison data question, you're likely over-calculating. Make your best strategic estimate and move forward.
Red flags that suggest Choice D:
- The quantities involve variables not fully specified in the data
- The question asks about individual data points when only aggregate statistics are provided
- The data source explicitly states "not all information is shown" or similar caveats
- You notice that changing a reasonable assumption would change which quantity is larger
Accuracy checklist before selecting your answer:
- Did I read the correct row/column from the table?
- Did I use the correct scale from the graph?
- Did I apply the right formula (mean vs. median, percent change vs. absolute change)?
- Are my units consistent between the two quantities?
- Could the relationship possibly be different from what I selected?
Memory Techniques
The "RACE" Mnemonic for Approach Strategy:
- Read the quantities first
- Analyze what data is needed
- Compare strategically (estimate when possible)
- Eliminate Choice D if both are calculable
The "SCALE" Acronym for Data Reading:
- Scale: Check if axes start at zero
- Categories: Verify you're reading the correct category/time period
- Axis labels: Confirm what each axis represents
- Legend: Understand what each color/pattern means
- Extraneous data: Ignore information not relevant to the quantities
Visualization Strategy for Choice D:
Picture Choice D as a question mark that only appears when something is unknown or variable. If you can replace both quantities with specific numbers, the question mark disappears and Choice D is impossible.
The "Mean-Median Mountain" Mental Image:
Visualize a distribution as a mountain. If the mountain leans right (right-skewed), the mean is pulled toward the tail and sits to the right of the median peak. If it leans left (left-skewed), the mean is pulled left of the median. Symmetric mountains have mean and median at the same peak point.
Percent Change Phrase: "New minus old, divided by old" - repeat this phrase to remember the percent change formula: (New - Old) / Old × 100%
The Four-Answer Mantra: Before every quantitative comparison question, mentally recite: "A-greater, B-greater, Equal, or Can't-tell" to remind yourself of the four possibilities and prevent accidentally selecting a non-existent fifth option.
Summary
Quantitative comparison data questions represent a high-yield question type on the GRE that combines data interpretation skills with the unique quantitative comparison format. Success requires mastering three integrated skill sets: accurately extracting relevant information from charts, tables, and graphs; understanding the four-answer-choice structure where you determine whether Quantity A is greater, Quantity B is greater, the quantities are equal, or the relationship cannot be determined; and applying strategic comparison techniques that often allow determination of the relationship without complete calculation. The most critical strategic principle is reading the quantities before analyzing the data in detail, which focuses attention on relevant information and prevents time-wasting analysis of extraneous data. Choice D ("cannot be determined") is only correct when insufficient information exists or variables could change the relationship—if both quantities can be calculated to specific numbers, one of A, B, or C must be correct. Common question types involve comparing statistical measures (mean versus median), percent changes across different categories, values from different time periods or groups, and calculated quantities requiring multiple data points. Efficient test-takers recognize when estimation or conceptual reasoning suffices, avoiding unnecessary calculation that consumes time and introduces error. Mastery of these questions requires attention to detail in reading scales, labels, and units, combined with strategic thinking about the most efficient path to determining the relationship between quantities.
Key Takeaways
- Quantitative comparison data questions combine data interpretation with the four-choice comparison format (A: Quantity A greater, B: Quantity B greater, C: Equal, D: Cannot be determined)
- Always read both quantities before examining the data source in detail to identify exactly what information is needed and filter out irrelevant data
- Choice D is only correct when information is insufficient or variables could change the answer—if both quantities are calculable to specific numbers, the relationship can always be determined
- Strategic comparison through estimation, conceptual reasoning, or algebraic manipulation often determines the relationship faster and more accurately than complete calculation
- Pay meticulous attention to scales, units, labels, and legends in data presentations, as misreading these elements is the most common source of errors
- Statistical measures (mean, median, range) have specific properties that enable strategic comparisons: mean is sensitive to outliers while median is resistant, and their relationship indicates distribution skewness
- Systematic approach saves time: read quantities → identify needed data → determine if Choice D applies → compare strategically → verify answer
Related Topics
Standard Quantitative Comparison Questions: Mastering data-based quantitative comparisons builds directly on the foundational skills of standard quantitative comparison questions without data sources. Understanding the core format and answer choices is essential before adding the data interpretation layer.
Data Interpretation Question Sets: These questions present data sources followed by multiple problem-solving questions. The data extraction and chart-reading skills developed for quantitative comparison data questions transfer directly to these multi-question sets, which typically appear 2-3 times per test.
Statistics and Data Analysis: Deeper study of statistical concepts (standard deviation, percentiles, correlation, probability distributions) enables more sophisticated analysis of data-based questions and appears in higher-difficulty problems.
Estimation and Approximation Techniques: Developing strong estimation skills enhances performance on quantitative comparison data questions by enabling faster determination of relationships without exact calculation, a skill valuable across all quantitative question types.
Graph Theory and Data Visualization: Advanced understanding of how different graph types represent relationships and trends improves both speed and accuracy in extracting information from visual data presentations.
Practice CTA
Now that you've mastered the core concepts and strategies for quantitative comparison data questions, it's time to put your knowledge into action. Attempt the practice questions designed specifically for this topic, applying the systematic approach and strategic techniques you've learned. Focus on reading the quantities first, extracting only relevant data, and determining when estimation suffices versus when calculation is necessary. Use the flashcards to reinforce high-yield facts and common patterns until recognizing question types becomes automatic. Remember: these questions reward strategic thinking and efficient data analysis, skills that improve dramatically with deliberate practice. Each question you work through strengthens your pattern recognition and builds the confidence needed to excel on test day. You've built a strong foundation—now apply it!
Sign up free to keep reading
Create a free AnvayaPrep account to finish this GRE guide on Quantitative comparison data questions — plus flashcards and practice questions.