Overview
The weighted average is a fundamental statistical concept that appears frequently on the GRE Quantitative Reasoning section, particularly within Data Analysis questions. Unlike a simple average where all values contribute equally to the final result, a weighted average assigns different levels of importance (weights) to different values based on their relative significance or frequency. This concept is essential for understanding how different components contribute proportionally to an overall outcome, whether calculating a student's final grade where exams count more than homework, determining the average price of stocks in a portfolio with varying numbers of shares, or finding the combined average when merging groups of different sizes.
Mastering gre weighted average problems is crucial because they test multiple quantitative skills simultaneously: proportional reasoning, algebraic manipulation, and conceptual understanding of how averages behave. These questions often appear disguised within word problems involving mixtures, combined groups, price calculations, or demographic data. The GRE frequently tests whether students can recognize when a weighted average is appropriate versus a simple average—a distinction that separates high scorers from average performers.
Within the broader Quantitative Reasoning framework, weighted averages connect directly to ratios, proportions, and basic statistics. They serve as a bridge between simple arithmetic operations and more complex data interpretation tasks. Understanding weighted averages also provides the foundation for comprehending more advanced statistical concepts like expected value in probability and variance calculations. For the GRE specifically, this topic integrates seamlessly with questions involving data interpretation from tables and graphs, making it a high-yield area for focused study.
Learning Objectives
- [ ] Identify when Weighted average is being tested in GRE questions
- [ ] Explain the core rule or strategy behind Weighted average calculations
- [ ] Apply Weighted average to GRE-style questions accurately
- [ ] Distinguish between situations requiring weighted averages versus simple averages
- [ ] Calculate unknown weights or values when given a weighted average
- [ ] Solve reverse weighted average problems where the final average is known
- [ ] Apply the mixture method and deviation method for efficient problem-solving
Prerequisites
- Basic arithmetic operations: Essential for performing the multiplication and division required in weighted average calculations
- Understanding of simple averages (arithmetic mean): Weighted averages build directly on this concept by adding the dimension of differential importance
- Ratio and proportion concepts: Weights are often expressed as ratios, and understanding proportional relationships is crucial for setting up equations
- Basic algebraic manipulation: Many weighted average problems require setting up and solving equations with variables
- Fractions and decimals proficiency: Weights are frequently expressed as fractions or percentages that must be converted and calculated accurately
Why This Topic Matters
Weighted averages appear extensively in real-world applications across business, science, and everyday decision-making. Companies use weighted averages to calculate inventory costs using different pricing methods, financial analysts employ them to determine portfolio returns where different investments have different amounts of capital allocated, and educators use them to compute final grades where assessments carry different point values. Understanding this concept enables better decision-making when different factors have varying levels of importance.
On the GRE, weighted average questions appear in approximately 10-15% of Quantitative Reasoning sections, making them a high-frequency topic that directly impacts scores. These questions typically appear as Problem Solving questions in the Data Analysis category, though they can also emerge within Quantitative Comparison questions. The GRE tests weighted averages through various contexts: combining groups with different averages, mixture problems involving solutions or alloys, calculating overall rates or prices, and interpreting data from tables where different categories have different frequencies.
The exam commonly disguises weighted average problems within scenarios involving: class averages when combining sections with different numbers of students, average speeds over different distances, average prices when purchasing different quantities, demographic statistics combining subgroups, and concentration problems involving mixtures. Recognizing these patterns is essential for efficient problem-solving, as students who fail to identify weighted average situations often waste time with incorrect approaches or fall into trap answers designed around simple average calculations.
Core Concepts
The Weighted Average Formula
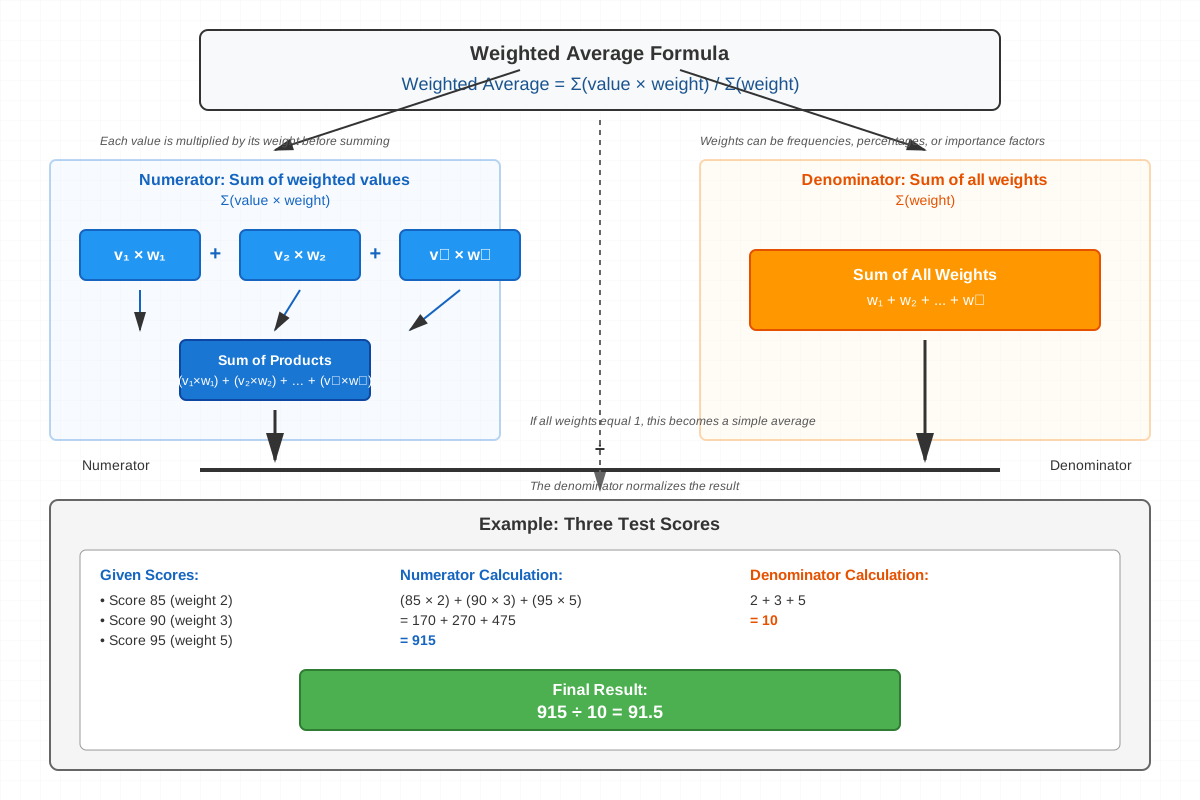
The weighted average is calculated by multiplying each value by its corresponding weight, summing these products, and dividing by the sum of all weights. The fundamental formula is:
Weighted Average = (w₁ × v₁ + w₂ × v₂ + ... + wₙ × vₙ) / (w₁ + w₂ + ... + wₙ)Where:
- v₁, v₂, ..., vₙ are the individual values
- w₁, w₂, ..., wₙ are the corresponding weights
- n is the number of values
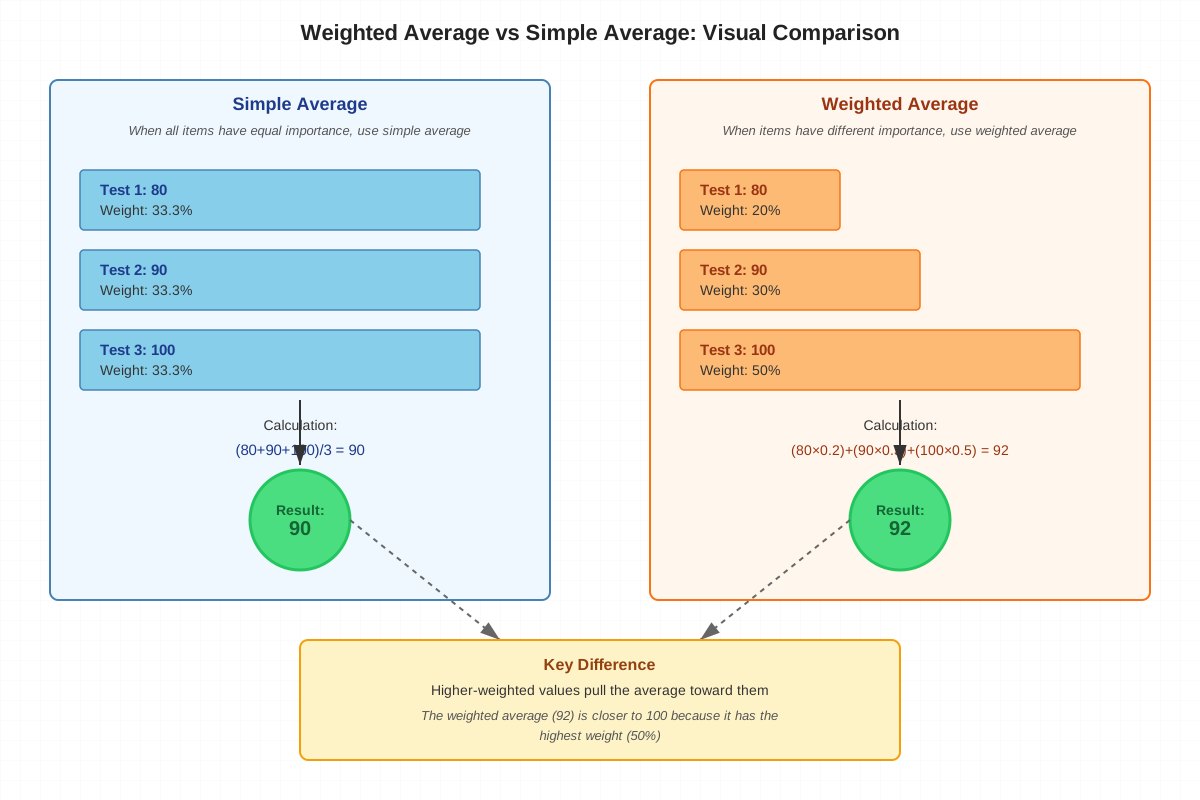
The weights represent the relative importance, frequency, or quantity associated with each value. When all weights are equal, the weighted average reduces to a simple average. The key insight is that values with larger weights pull the weighted average closer to themselves, while values with smaller weights have less influence on the final result.
Understanding Weights as Frequencies
In many GRE problems, weights represent the number of items or frequency of occurrence. For example, if Class A has 20 students with an average score of 85, and Class B has 30 students with an average score of 75, the weight for each class is the number of students. The combined average is:
Combined Average = (20 × 85 + 30 × 75) / (20 + 30) = (1700 + 2250) / 50 = 3950 / 50 = 79Notice that the combined average (79) is closer to 75 than to 85 because Class B has more students (higher weight). This illustrates a crucial principle: the weighted average always falls between the minimum and maximum values, positioned closer to values with higher weights.
The Deviation Method (Shortcut Approach)
The deviation method provides an efficient alternative for calculating weighted averages, particularly useful under time pressure. This method calculates how far the weighted average deviates from a reference point:
- Choose a reference value (often one of the given values)
- Calculate the deviation of each value from the reference
- Calculate the weighted average of deviations
- Add this average deviation to the reference value
Using the previous example with reference point 85:
- Class A deviation: 85 - 85 = 0
- Class B deviation: 75 - 85 = -10
- Weighted average deviation: (20 × 0 + 30 × (-10)) / 50 = -300 / 50 = -6
- Final average: 85 + (-6) = 79
This method is particularly powerful when one weight is significantly larger or when working with values close to a round number.
The Mixture Method (Ratio Approach)
For problems involving exactly two groups or components, the mixture method uses ratios to find the weighted average position between two values. If combining two groups with averages A and B in ratio m:n, the weighted average W can be found using:
(W - A) / (B - W) = n / mThis creates a proportion showing that the weighted average divides the distance between A and B inversely proportional to the weights. This method is especially efficient for Quantitative Comparison questions where exact calculation isn't necessary—only determining which side is larger.
Reverse Weighted Average Problems
The GRE frequently tests the ability to work backward from a known weighted average to find unknown weights or values. These problems require setting up algebraic equations. For example: "If the average of 40 students is 75, and after adding more students the average becomes 78, how many students were added if their average was 85?"
Setup: (40 × 75 + x × 85) / (40 + x) = 78
Solving: 3000 + 85x = 78(40 + x)
3000 + 85x = 3120 + 78x
7x = 120
x = 17.14... (approximately 17 students)
Weighted Averages with Percentages
When weights are given as percentages, they must sum to 100% (or 1.0 as a decimal). For example, if a final grade is calculated as 20% homework, 30% midterm, and 50% final exam, with scores of 90, 85, and 88 respectively:
Final Grade = 0.20(90) + 0.30(85) + 0.50(88) = 18 + 25.5 + 44 = 87.5The GRE often tests whether students correctly convert percentages to decimals and whether they recognize that percentage weights must be complete (sum to 100%).
Comparison Table: Simple vs. Weighted Average
| Aspect | Simple Average | Weighted Average |
|---|---|---|
| Formula | Sum of values / Number of values | Sum of (value × weight) / Sum of weights |
| When to use | All values equally important | Values have different importance/frequency |
| Calculation complexity | Lower | Higher |
| Result position | Exact center of values | Closer to higher-weighted values |
| GRE frequency | Moderate | High |
Concept Relationships
The weighted average concept builds directly on the foundation of simple averages by adding the dimension of differential importance. The relationship flows: Simple Average → Weighted Average → Expected Value (in probability). Understanding that a simple average is merely a special case of weighted average (where all weights equal 1) helps students recognize when the more sophisticated approach is necessary.
Within weighted average problems themselves, the core formula connects to the deviation method through algebraic equivalence—both produce identical results but offer different computational pathways. The mixture method represents a specialized application for two-component problems, deriving from the general weighted average formula through algebraic manipulation. These three approaches (formula, deviation, mixture) form a toolkit where problem characteristics determine the most efficient method.
Weighted averages connect to prerequisite topics through multiple pathways: Ratios and Proportions → Weights → Weighted Average and Fractions → Percentage Weights → Weighted Average Calculation. The concept also extends forward to more advanced topics: Weighted Average → Probability (Expected Value) → Statistics (Variance). On the GRE, weighted averages frequently appear integrated with data interpretation, requiring students to extract values and weights from tables or graphs before performing calculations.
The relationship between weights and the final average position follows an inverse proportion principle: larger weights pull the average toward their associated values more strongly. This creates a conceptual model: Weight Magnitude → Influence on Average → Final Average Position. Understanding this relationship enables estimation and elimination of unreasonable answer choices without complete calculation.
High-Yield Facts
⭐ The weighted average always falls between the minimum and maximum values being averaged, positioned closer to values with higher weights
⭐ When combining two groups, if the weighted average equals one group's average, the other group must have zero weight (no members)
⭐ For two groups with equal weights, the weighted average equals the simple average of the two group averages
⭐ Percentage weights must sum to exactly 100% (or 1.0 as decimal); if they don't, the problem setup is incomplete
⭐ In mixture problems, the ratio of distances from the weighted average to each component value equals the inverse ratio of the weights
- The weighted average of a set cannot be less than the minimum value or greater than the maximum value in that set
- When all weights are equal, the weighted average equals the simple arithmetic mean
- Doubling all weights does not change the weighted average (only relative weights matter)
- If one component has a weight much larger than all others combined, the weighted average will be very close to that component's value
- In reverse problems where the weighted average is given, there are infinitely many combinations of weights and values that could produce that average (unless additional constraints are provided)
- The deviation method is most efficient when one value appears as a weight multiple times or when values cluster around a convenient reference point
- For GRE purposes, weighted average problems with more than three components are rare; most involve two or three groups/values
Quick check — test yourself on Weighted average so far.
Try Flashcards →Common Misconceptions
Misconception: The weighted average of two groups is always the simple average of their individual averages.
Correction: The weighted average only equals the simple average when the groups have equal weights (sizes). Otherwise, the weighted average is pulled toward the larger group's average. For groups of 10 students averaging 80 and 30 students averaging 70, the combined average is 72.5, not 75.
Misconception: Weights must always be whole numbers representing counts of items.
Correction: Weights can be any positive numbers, including fractions, decimals, or percentages. They represent relative importance, which can be expressed in various forms. A grade weighted 0.3 for midterm and 0.7 for final is perfectly valid.
Misconception: When combining groups, you can average the averages by adding them and dividing by the number of groups.
Correction: This only works when groups have equal sizes. With unequal groups, you must use the weighted average formula, accounting for group sizes. Simply averaging 85 and 75 gives 80, but if these are averages for groups of 20 and 30 students respectively, the correct answer is 79.
Misconception: The weighted average must be closer to the arithmetic middle of all values than to any extreme value.
Correction: If one value has a sufficiently large weight, the weighted average can be very close to that value, even if other values are far away. With values 10 (weight 1) and 90 (weight 99), the weighted average is 89.2, much closer to 90 than to the midpoint of 50.
Misconception: In percentage weight problems, if weights are given as 20%, 30%, and 40%, you can proceed with calculation.
Correction: These weights sum to only 90%, indicating missing information. Either there's another component worth 10%, or the problem is incomplete. Always verify that percentage weights sum to 100% before calculating.
Misconception: Weighted averages can be calculated by finding the simple average first, then adjusting it by the weights.
Correction: There's no simple adjustment factor that converts a simple average to a weighted average. The weighted average must be calculated using the proper formula from the start, as the relationship between simple and weighted averages depends on the specific weight distribution.
Worked Examples
Example 1: Combining Groups with Different Averages
Problem: A company has two departments. The marketing department has 25 employees with an average salary of $65,000, while the engineering department has 35 employees with an average salary of $82,000. What is the average salary across both departments?
Solution:
Step 1: Identify that this is a weighted average problem because the groups have different sizes (weights).
- Marketing: 25 employees (weight), $65,000 (value)
- Engineering: 35 employees (weight), $82,000 (value)
Step 2: Apply the weighted average formula:
Weighted Average = (w₁ × v₁ + w₂ × v₂) / (w₁ + w₂)Step 3: Substitute values:
Average Salary = (25 × 65,000 + 35 × 82,000) / (25 + 35)Step 4: Calculate numerator:
- 25 × 65,000 = 1,625,000
- 35 × 82,000 = 2,870,000
- Sum = 4,495,000
Step 5: Calculate denominator:
- 25 + 35 = 60
Step 6: Divide:
- 4,495,000 / 60 = 74,916.67
Answer: The average salary is approximately $74,917.
Verification using deviation method: Using $65,000 as reference:
- Marketing deviation: 0
- Engineering deviation: 82,000 - 65,000 = 17,000
- Weighted deviation: (25 × 0 + 35 × 17,000) / 60 = 595,000 / 60 = 9,916.67
- Final: 65,000 + 9,916.67 = 74,916.67 ✓
Connection to learning objectives: This problem demonstrates identifying a weighted average situation (different group sizes), applying the core formula, and verifying accuracy through an alternative method.
Example 2: Reverse Weighted Average Problem
Problem: A chemistry student has completed three lab reports with an average score of 88. She has one more lab report to complete. If she wants to achieve an overall average of 90 for all four lab reports, what score must she earn on the final report?
Solution:
Step 1: Recognize this as a reverse weighted average problem where we know the desired final average and need to find an unknown value.
Step 2: Set up the equation. Let x = score needed on the fourth report.
- Current: 3 reports averaging 88
- Total points so far: 3 × 88 = 264
- Desired: 4 reports averaging 90
- Total points needed: 4 × 90 = 360
Step 3: Create equation:
(264 + x) / 4 = 90Step 4: Solve for x:
- 264 + x = 360
- x = 360 - 264
- x = 96
Answer: She must score 96 on the final lab report.
Verification: (88 + 88 + 88 + 96) / 4 = 360 / 4 = 90 ✓
Alternative approach using deviation method:
- Current average: 88
- Desired average: 90
- Increase needed: 2 points per report
- Total increase for 4 reports: 4 × 2 = 8 points
- These 8 points must come from the last report alone
- Score needed: 88 + 8 = 96 ✓
Connection to learning objectives: This demonstrates applying weighted average concepts to solve for unknown values, using algebraic manipulation, and verifying answers through multiple methods—all essential GRE skills.
Exam Strategy
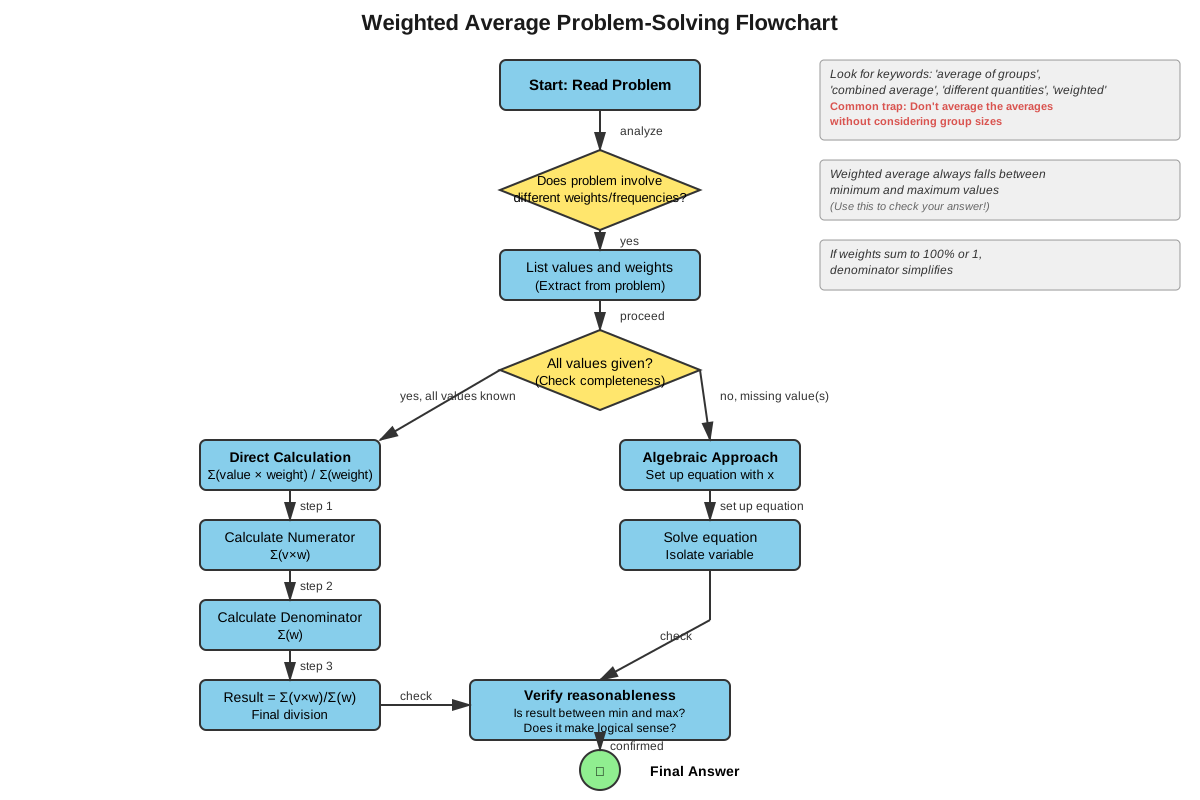
When approaching gre weighted average questions, begin by identifying trigger phrases that signal weighted average situations: "combined average," "overall average," "different groups," "various quantities," "mixture of," or any scenario where components have different sizes, frequencies, or importance levels. The presence of two or more groups with different characteristics is the primary indicator.
Step-by-step approach:
- Identify values and weights: Extract the numerical values being averaged and their corresponding weights (frequencies, quantities, percentages)
- Verify weight completeness: Ensure weights are complete (sum appropriately) and consistent in units
- Choose calculation method: Select formula method for straightforward problems, deviation method for convenient reference points, or mixture method for two-component problems
- Estimate before calculating: Determine where the answer should fall (closer to which value) to catch calculation errors
- Check answer reasonableness: Verify the result falls between minimum and maximum values and is positioned logically based on weights
Trigger words and phrases to watch for:
- "Combined," "overall," "total," "average of averages"
- "Different numbers of," "various quantities," "unequal groups"
- "Weighted by," "counts for X%," "worth X points"
- "Mixture," "solution," "alloy" (often weighted average in disguise)
- "After adding," "after removing" (signals changing weights)
Process of elimination strategies:
Exam Tip: If answer choices include the simple average of the given values, that's almost always a trap answer for weighted average problems. Eliminate it immediately unless weights are explicitly equal.
- Eliminate any answer outside the range of given values (weighted average must fall between min and max)
- Eliminate answers that don't respect the weight distribution (should be closer to higher-weighted values)
- For Quantitative Comparison, often you can determine which quantity is larger without calculating exact values
- When weights are nearly equal, the weighted average will be close to the simple average
- When one weight dominates, the weighted average will be very close to that component's value
Time allocation advice: Allocate 1.5-2 minutes for standard weighted average problems. If a problem requires more than basic calculation (multiple steps, reverse solving, or complex algebra), budget up to 2.5 minutes. If you cannot identify the approach within 30 seconds, mark for review and move on—these problems can become time sinks if the setup isn't clear.
Memory Techniques
Mnemonic for the weighted average formula: "Values Wear Weights" (VWW)
- Values get multiplied by
- Weights, then divided by
- Weight sum
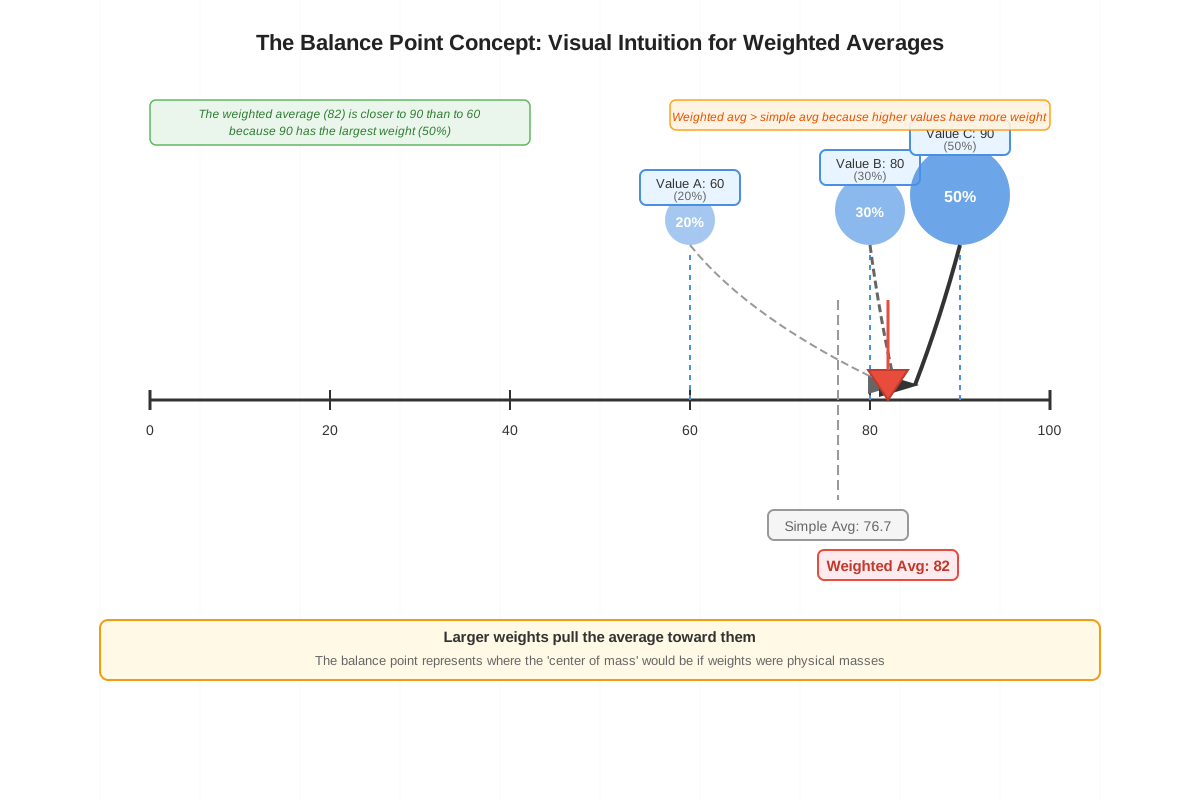
Visualization strategy: Picture a seesaw or balance beam. The weighted average is the fulcrum point where the beam balances. Heavier weights (larger groups) pull the balance point toward their position. This physical analogy helps remember that the weighted average shifts toward higher-weighted values.
The "Pull Principle": Remember that weights PULL the average:
- Position matters: larger weights pull harder
- Unequal groups need weighted average
- Location of average: between min and max
- Larger weight = closer to that value
Acronym for problem-solving steps: VICE
- Values: identify all values being averaged
- Identify weights for each value
- Calculate using appropriate method
- Evaluate reasonableness of answer
Memory hook for common mistake: "Don't average the averages!" When you see two group averages, resist the temptation to simply add them and divide by 2. Instead, think "Different sizes? Weighted average!"
Percentage weight reminder: "100% Complete" - percentage weights must sum to exactly 100%, or you're missing information.
Summary
Weighted averages represent a critical extension of simple averages where different values contribute unequally to the final result based on their weights (importance, frequency, or quantity). The fundamental formula multiplies each value by its weight, sums these products, and divides by the total weight. On the GRE, weighted average problems appear frequently in Data Analysis questions, often disguised within scenarios involving combined groups, mixtures, or situations where components have different sizes. Success requires recognizing when weights differ (triggering weighted average rather than simple average), correctly identifying values and their corresponding weights, and efficiently calculating using the standard formula, deviation method, or mixture method depending on problem characteristics. The weighted average always falls between the minimum and maximum values, positioned closer to values with higher weights—a principle useful for estimation and answer verification. Common pitfalls include averaging averages when groups have unequal sizes, failing to verify that percentage weights sum to 100%, and not recognizing weighted average situations. Mastery involves both computational accuracy and strategic problem recognition, enabling efficient solution of these high-frequency GRE questions.
Key Takeaways
- Weighted average accounts for differential importance: Unlike simple averages, weighted averages multiply each value by its weight before averaging, reflecting that some values contribute more to the final result
- The result always falls between extremes, pulled toward higher weights: The weighted average must lie between the minimum and maximum values, positioned closer to values with larger weights
- Recognition is half the battle: Identifying when a problem requires weighted average (different group sizes, unequal frequencies, varying importance) versus simple average is crucial for correct approach
- Three solution methods provide flexibility: The standard formula, deviation method, and mixture method offer different computational paths; choose based on problem characteristics and personal preference
- Percentage weights must be complete: When weights are given as percentages, verify they sum to 100%; incomplete percentages indicate missing information
- Never average the averages with unequal groups: The most common error is calculating the simple average of group averages when groups have different sizes; always account for weights
- Estimation prevents calculation errors: Before computing, determine approximately where the answer should fall based on weight distribution; use this to verify your calculated result
Related Topics
Expected Value in Probability: Weighted averages form the foundation for expected value calculations, where outcomes are weighted by their probabilities. Mastering weighted averages enables understanding how to calculate the long-run average result of probabilistic situations.
Standard Deviation and Variance: These measures of spread build on weighted average concepts, using squared deviations from the mean weighted by frequencies. Understanding how weights affect averages prepares students for comprehending how they affect variability measures.
Mixture Problems: A specialized application of weighted averages involving combining solutions, alloys, or groups with different concentrations or characteristics. These problems require the same weighted average principles applied to concentration or percentage contexts.
Rate Problems with Varying Conditions: Average speed over different distances or average rate over different time periods requires weighted average calculations where distances or times serve as weights.
Data Interpretation from Tables and Graphs: Many GRE data interpretation questions require extracting values and frequencies from visual displays, then calculating weighted averages to answer questions about combined or overall statistics.
Practice CTA
Now that you've mastered the concepts, formulas, and strategies for weighted average problems, it's time to solidify your understanding through practice. Attempt the practice questions designed specifically for this topic, focusing on recognizing weighted average situations quickly and applying the most efficient solution method. Use the flashcards to reinforce key formulas, common pitfalls, and trigger phrases. Remember that weighted average questions are high-frequency on the GRE—every problem you practice increases your speed and accuracy, directly impacting your Quantitative Reasoning score. Approach each practice question strategically, estimate before calculating, and review both correct and incorrect answers to understand the underlying patterns. Your investment in mastering this topic will pay dividends on test day!
Sign up free to keep reading
Create a free AnvayaPrep account to finish this GRE guide on Weighted average — plus flashcards and practice questions.