Overview
The median is a fundamental measure of central tendency that appears frequently on the GRE Quantitative Reasoning section, particularly within Data Analysis questions. Unlike the mean (average), which can be heavily influenced by extreme values, the median represents the middle value in an ordered dataset, making it a robust indicator of the "typical" value in a distribution. Understanding how to calculate, interpret, and apply the median is essential for success on the GRE, as test-makers frequently design questions that require students to distinguish between different measures of central tendency or to work with datasets where the median provides more meaningful information than other statistics.
The GRE median questions test not only computational ability but also conceptual understanding of how data organization affects statistical measures. Students must be comfortable working with both odd and even numbers of data points, understanding how adding or removing values changes the median, and recognizing when the median is the most appropriate measure to use. These questions often appear in Quantitative Comparison format, Data Interpretation sets, or Problem Solving questions that involve analyzing lists, sequences, or distributions.
Mastery of median concepts connects directly to broader Quantitative Reasoning skills including number properties, arithmetic operations, and logical reasoning. The median serves as a bridge between basic statistics and more advanced data analysis concepts, and it frequently appears alongside questions about mean, mode, range, and standard deviation. Strong performance on median questions requires both procedural fluency (knowing how to find the median) and conceptual depth (understanding what the median represents and how it behaves under different conditions).
Learning Objectives
- [ ] Identify when Median is being tested in GRE questions
- [ ] Explain the core rule or strategy behind Median calculations
- [ ] Apply Median to GRE-style questions accurately
- [ ] Calculate the median for both odd and even numbers of data points
- [ ] Determine how adding, removing, or changing values affects the median
- [ ] Compare and contrast median with other measures of central tendency
- [ ] Solve complex problems involving unknown values in datasets where the median is given
Prerequisites
- Basic arithmetic operations: Addition, division, and ordering numbers are essential for calculating medians and working with datasets
- Understanding of number ordering: The ability to arrange numbers from least to greatest is fundamental to finding the median position
- Familiarity with fractions and decimals: Median calculations with even datasets often result in non-integer values
- Basic set notation: Understanding how to interpret lists and sets of numbers as they appear in GRE questions
Why This Topic Matters
In real-world applications, the median provides critical insights in fields ranging from economics (median household income) to healthcare (median survival times) to education (median test scores). The median is particularly valuable when dealing with skewed distributions or data containing outliers, as it remains stable when extreme values are present. For instance, median home prices better represent typical housing costs than mean prices, which can be inflated by a few luxury properties.
On the GRE, median questions appear with high frequency—approximately 10-15% of Data Analysis questions involve median calculations or concepts. These questions manifest in several formats: direct calculation problems asking students to find the median of a given dataset, Quantitative Comparison questions requiring students to compare medians of different sets, Data Interpretation questions where students must extract values from tables or graphs to determine medians, and complex problem-solving questions where the median is given and students must determine possible values or constraints on the dataset.
The GRE specifically tests median concepts because they assess multiple competencies simultaneously: careful reading, systematic organization of information, precise calculation, and conceptual reasoning about how statistics behave. Test-makers favor median questions because they can be designed at various difficulty levels, from straightforward calculations to sophisticated problems involving algebraic reasoning with unknown values.
Core Concepts
Definition and Basic Calculation
The median is the middle value in a dataset when all values are arranged in ascending (or descending) order. This measure of central tendency divides a dataset into two equal halves, with 50% of values falling at or below the median and 50% at or above it. The calculation method depends on whether the dataset contains an odd or even number of values.
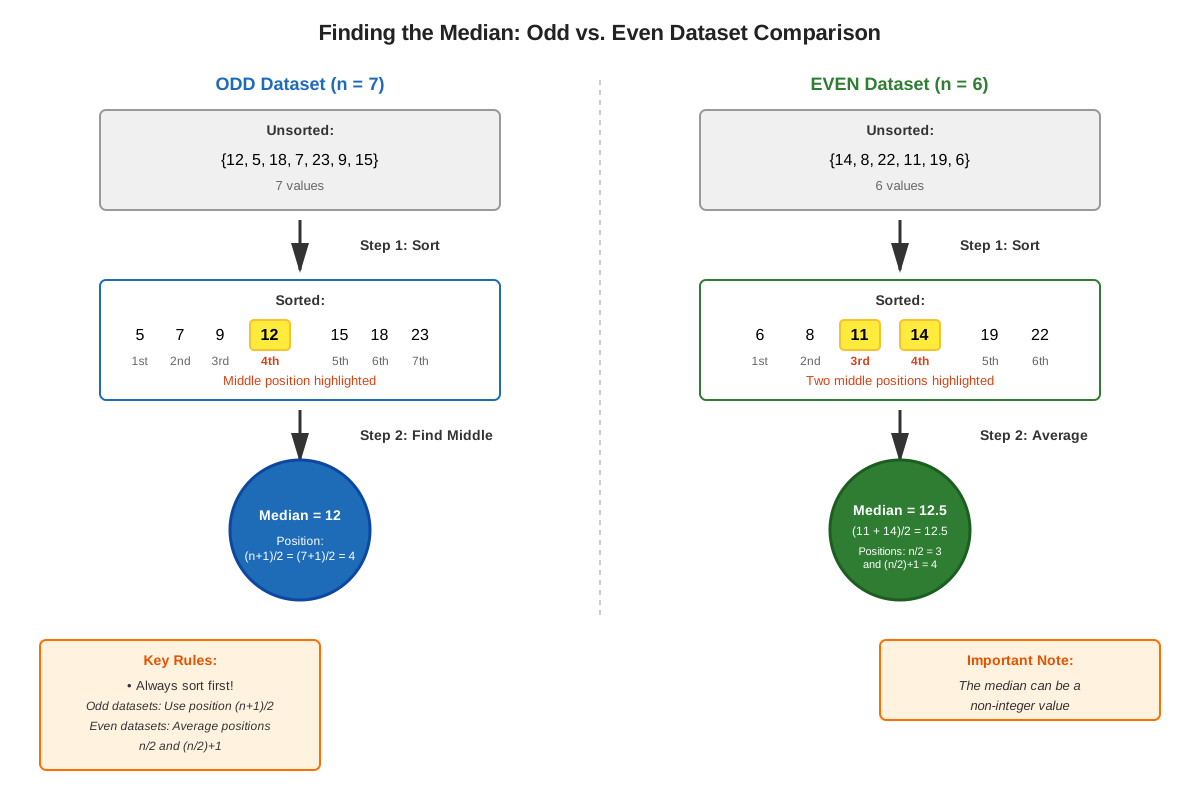
For datasets with an odd number of values, the median is simply the middle value after ordering. If there are n values where n is odd, the median is the value at position (n+1)/2. For example, in the dataset {3, 7, 9, 15, 21}, which contains 5 values, the median is at position (5+1)/2 = 3, making the median 9.
For datasets with an even number of values, the median is the arithmetic mean (average) of the two middle values. If there are n values where n is even, the median is the average of the values at positions n/2 and (n/2)+1. For example, in the dataset {2, 5, 8, 12, 15, 20}, which contains 6 values, the two middle values are at positions 3 and 4 (values 8 and 12), so the median is (8+12)/2 = 10.
Step-by-Step Median Calculation Process
- Arrange all values in order from least to greatest (or greatest to least—the median will be the same)
- Count the total number of values (n) in the dataset
- Determine if n is odd or even
- If n is odd: Identify the middle position using (n+1)/2 and select that value
- If n is even: Identify the two middle positions using n/2 and (n/2)+1, then calculate their average
Properties of the Median
The median possesses several important properties that distinguish it from other measures of central tendency:
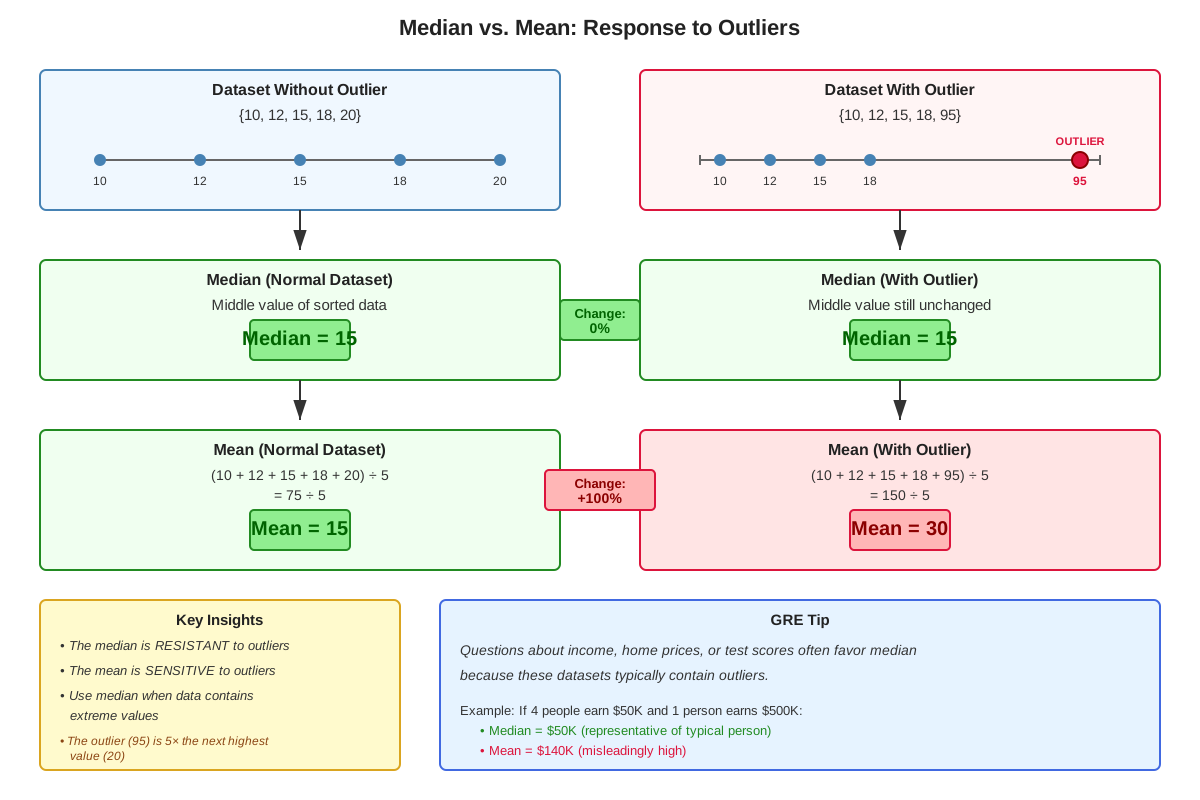
- Resistance to outliers: Extreme values do not affect the median's position, making it more representative of typical values in skewed distributions
- Ordinal nature: The median depends only on the order of values, not their specific magnitudes beyond their ranking
- Uniqueness: Every dataset has exactly one median value
- Positional stability: Changing values above the median (while keeping them above) or below the median (while keeping them below) does not change the median itself
Median vs. Mean Comparison
| Characteristic | Median | Mean |
|---|---|---|
| Definition | Middle value when ordered | Sum divided by count |
| Sensitivity to outliers | Resistant | Highly sensitive |
| Calculation complexity | Requires ordering | Requires only addition and division |
| Best used when | Data is skewed or has outliers | Data is symmetrically distributed |
| Always equals a data value? | Yes (for odd n), No (for even n) | Usually no |
Working with Unknown Values
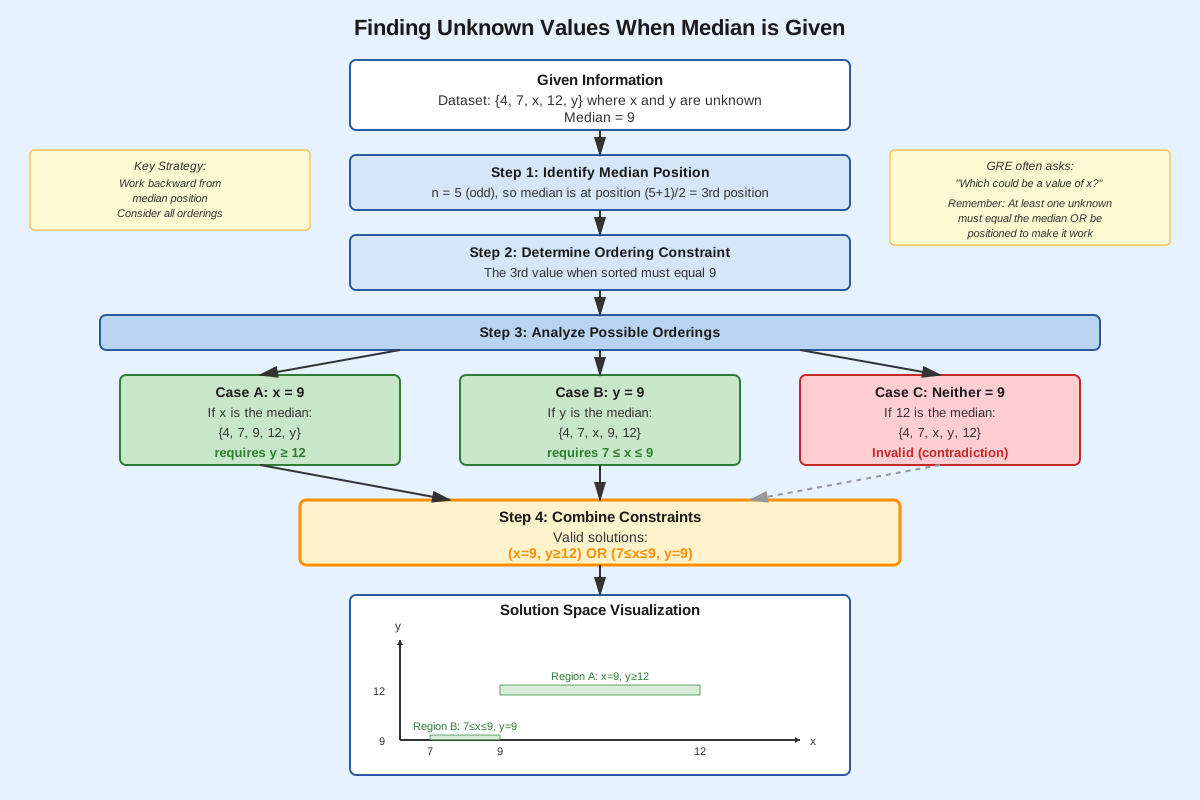
GRE questions frequently present scenarios where some values in a dataset are unknown, and students must use the given median to determine constraints or possible values. When the median is provided, it establishes a boundary condition: for odd-sized datasets, the middle value is known; for even-sized datasets, the average of the two middle values is known.
For example, if a dataset of 5 values has a median of 12, the third value (when ordered) must be 12. The first two values must be ≤12, and the last two values must be ≥12. This creates a framework for solving problems involving unknown quantities.
Effect of Adding or Removing Values
Understanding how the median changes when values are added or removed is crucial for GRE success:
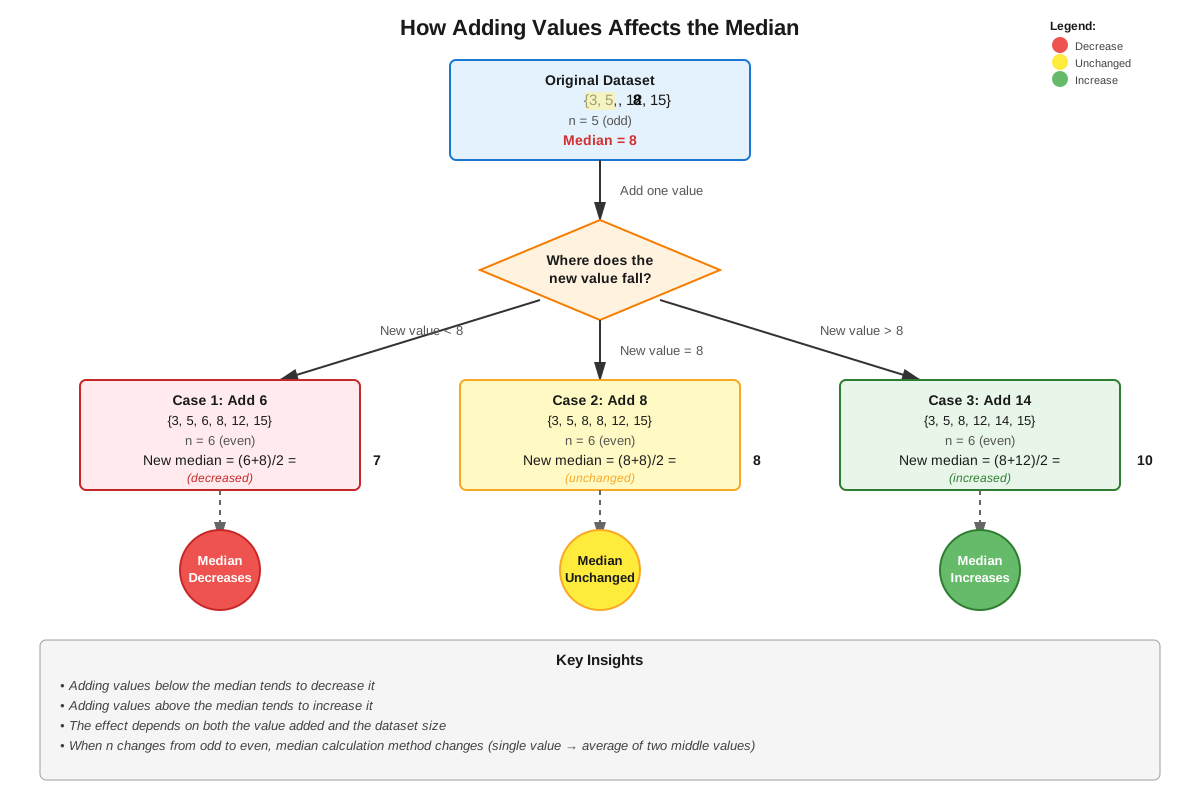
- Adding a value above the current median may increase the median (if the dataset size changes from odd to even or if it shifts the middle position upward)
- Adding a value below the current median may decrease the median (through similar mechanisms)
- Adding a value equal to the current median typically keeps the median stable or equal to that value
- Removing values shifts the middle position and can significantly change the median depending on which values are removed
Median in Frequency Distributions
When data is presented in frequency tables, the median calculation requires accounting for repeated values. The total number of data points is the sum of all frequencies, and the median position is determined using this total. Students must then identify which value corresponds to the middle position by cumulating frequencies until reaching the median position.
Concept Relationships
The median concept connects internally through a logical progression: basic ordering of numbers → identification of middle position → calculation method selection (odd vs. even) → interpretation of results → application to complex scenarios with unknowns. Each step builds upon the previous, with the fundamental skill of ordering serving as the foundation for all median work.
The median relates to prerequisite topics through its dependence on number ordering (a basic arithmetic skill) and its calculation requiring division and averaging (for even-sized datasets). These foundational skills enable median computation, while the median itself serves as a building block for understanding more advanced statistical concepts.
Externally, the median connects to other measures of central tendency (mean and mode) as alternative ways to describe the "center" of a dataset. The relationship can be mapped as: Data Collection → Ordering → Median Calculation → Comparison with Mean → Selection of Appropriate Measure → Data Interpretation. Understanding when to use median versus mean requires recognizing distribution characteristics, particularly the presence of outliers or skewness.
The median also relates to concepts of percentiles and quartiles, where the median represents the 50th percentile or second quartile. This connection extends median understanding into more sophisticated data analysis frameworks tested on the GRE.
High-Yield Facts
⭐ The median is the middle value of an ordered dataset, dividing it into two equal halves
⭐ For odd-sized datasets, the median is always a value that appears in the dataset
⭐ For even-sized datasets, the median is the average of the two middle values and may not appear in the dataset
⭐ The median is resistant to outliers, unlike the mean, which makes it preferable for skewed distributions
⭐ To find the median position in an odd-sized dataset of n values, use position (n+1)/2
- For even-sized datasets of n values, average the values at positions n/2 and (n/2)+1
- Changing values above the median (while keeping them above) does not change the median
- Changing values below the median (while keeping them below) does not change the median
- In a perfectly symmetric distribution, the mean and median are equal
- Adding a value equal to the current median to an odd-sized dataset keeps the median unchanged
- The median of a dataset with repeated values is calculated the same way as any other dataset
- When data is presented in a frequency table, the total count is the sum of all frequencies
Quick check — test yourself on Median so far.
Try Flashcards →Common Misconceptions
Misconception: The median is always one of the numbers in the original dataset.
Correction: While this is true for odd-sized datasets, the median of an even-sized dataset is the average of the two middle values, which may not appear in the original data. For example, the median of {1, 2, 3, 4} is 2.5, which is not in the dataset.
Misconception: The median is calculated by adding all values and dividing by the count.
Correction: This describes the mean (average), not the median. The median requires ordering the data and finding the middle value or the average of the two middle values, without summing all values.
Misconception: Outliers affect the median the same way they affect the mean.
Correction: The median is resistant to outliers because it depends only on the middle position(s), not on the magnitude of extreme values. Changing the largest value in a dataset from 100 to 1,000,000 typically won't change the median at all, but it will dramatically increase the mean.
Misconception: You must always arrange data from smallest to largest to find the median.
Correction: While arranging from smallest to largest is conventional, arranging from largest to smallest produces the same median. The key is consistent ordering, not the direction of that ordering.
Misconception: Adding any new value to a dataset will change the median.
Correction: The effect on the median depends on where the new value falls relative to the current median and whether the dataset size is odd or even. Adding a value equal to the current median often keeps it unchanged, and adding values far from the median may have minimal or no effect.
Misconception: The median of a dataset is always located at the physical center when values are listed.
Correction: The median is the center of the ordered dataset. If values are not arranged in order, the physical middle position is meaningless for median calculation. Always order first.
Misconception: If two datasets have the same median, they must have similar distributions.
Correction: Datasets with identical medians can have vastly different distributions. For example, {1, 5, 9} and {4, 5, 100} both have a median of 5 but very different spreads and means.
Worked Examples
Example 1: Basic Median Calculation with Odd and Even Datasets
Problem: Dataset A consists of the values {12, 7, 23, 15, 9}. Dataset B consists of the values {8, 14, 11, 20, 6, 17}. What is the median of Dataset A, and what is the median of Dataset B?
Solution:
For Dataset A:
- Step 1: Order the values: {7, 9, 12, 15, 23}
- Step 2: Count the values: n = 5 (odd)
- Step 3: Find the middle position: (5+1)/2 = 3
- Step 4: The value at position 3 is 12
- Median of Dataset A = 12
For Dataset B:
- Step 1: Order the values: {6, 8, 11, 14, 17, 20}
- Step 2: Count the values: n = 6 (even)
- Step 3: Find the two middle positions: 6/2 = 3 and (6/2)+1 = 4
- Step 4: The values at positions 3 and 4 are 11 and 14
- Step 5: Calculate the average: (11+14)/2 = 25/2 = 12.5
- Median of Dataset B = 12.5
This example demonstrates the core calculation procedures and addresses the learning objective of applying median calculations accurately to different dataset sizes.
Example 2: Median with Unknown Values (GRE-Style)
Problem: A dataset consists of 7 numbers. Five of the numbers are 3, 8, 11, 15, and 22. If the median of the dataset is 11, what is the greatest possible value of the sum of the two unknown numbers?
Solution:
- Step 1: Recognize that with 7 numbers (odd), the median is the 4th value when ordered
- Step 2: Since the median is 11, the 4th value must be 11 when all seven numbers are ordered
- Step 3: We already have 11 in our known values, so it will be the 4th position
- Step 4: For 11 to be in the 4th position, we need exactly 3 values ≤11 and exactly 3 values ≥11
- Step 5: Currently, we have values ≤11: {3, 8, 11} (three values)
- Step 6: Currently, we have values >11: {15, 22} (two values)
- Step 7: To maximize the sum of the two unknowns while maintaining the median of 11, we need one unknown to be ≤11 and one to be ≥11
- Step 8: To maximize the sum, make the unknown that's ≤11 as large as possible (11) and the unknown that's ≥11 as large as possible (no upper limit, but we want the maximum)
- Step 9: However, there's no stated upper limit, so theoretically, the sum could be infinite
Wait—let's reconsider: The problem asks for the greatest possible sum, which suggests there should be a finite answer. Let's re-examine the constraints.
Actually, upon reflection, since one unknown must be ≤11 to maintain three values at or below the median position, the maximum value for that unknown is 11. The other unknown must be ≥11, and since there's no upper bound stated, we should interpret this as asking: given typical GRE constraints, what's the maximum?
Better approach:
- We need 3 values ≤11 (we have 3, 8, 11)
- We need 3 values ≥11 (we have 11, 15, 22)
- One unknown must be ≤11 (maximum value: 11)
- One unknown must be ≥11 (no maximum stated, but let's assume the question implies reasonable bounds)
If the question is well-posed for the GRE, it likely expects us to recognize that one unknown should be 11 (to be ≤11 while maximizing) and the other can be any value ≥11. Without an upper bound, the answer would be unbounded.
More realistic GRE version: If the problem stated "all values are positive integers less than 30," then:
- One unknown = 11 (maximum while ≤11)
- Other unknown = 29 (maximum while <30 and ≥11)
- Maximum sum = 11 + 29 = 40
This example illustrates how median problems with unknowns require careful logical reasoning about constraints and positions, addressing the learning objective of applying median concepts to complex GRE-style questions.
Exam Strategy
When approaching GRE median questions, begin by identifying the question type. Look for trigger phrases such as "middle value," "median," "50th percentile," or questions asking about the "center" of a dataset that isn't explicitly asking for the mean. These signal that median calculation or reasoning is required.
Immediate action steps:
- Determine if you need to calculate the median or use a given median to find unknowns
- Count the number of values in the dataset (write "n = ?" if needed)
- If calculating the median, immediately order the values before doing anything else
- Circle or mark the middle position(s) to avoid counting errors
For Quantitative Comparison questions involving medians:
- Don't calculate both quantities fully if you can determine the relationship through reasoning
- Consider whether adding/removing values affects one median more than another
- Look for datasets where the median is obviously larger or smaller based on the values' positions
- Remember that identical medians don't mean identical datasets
Process of elimination tips:
- Eliminate answer choices that would require the median to be a value that couldn't possibly be in the middle position
- For questions about how the median changes, eliminate options that suggest the median is as sensitive as the mean to outliers
- If a question asks for possible values and you've determined the median position, eliminate any answer that would violate the ordering requirement
Time allocation:
- Simple median calculations: 30-45 seconds
- Median with unknown values: 1-2 minutes
- Complex data interpretation with median: 2-3 minutes
- If you're spending more than 2 minutes on a median calculation problem, you may be overcomplicating it—consider whether there's a simpler logical approach
Common traps to avoid:
- Don't confuse median with mean—read carefully
- Don't forget to order the data before finding the middle
- Don't assume the median changes when extreme values are added
- Don't calculate the median of frequencies instead of the median of the actual data values in frequency tables
Memory Techniques
MEDIAN mnemonic: Middle Element Determined In Arranged Numbers
- This reminds you that the median is the middle element and that arrangement (ordering) is required
"Odd One Out" rule: For odd datasets, the median is one actual value from the dataset (the middle one). For even datasets, you need to average two values.
Visualization strategy: Picture a seesaw or balance beam. The median is the balance point where half the data points are on each side. Extreme values (outliers) don't move the balance point because they're already at the far ends—they can get more extreme without affecting the center.
Position formula memory aid:
- Odd: (n+1)/2 gives you ONE position
- Even: n/2 and (n/2)+1 gives you TWO positions
"Order First" mantra: Before doing anything with median problems, repeat "Order first, order first." This prevents the most common error—trying to find the middle of an unordered list.
Resistance reminder: Think "Median is RESISTANT" (to outliers). The word "resistant" sounds strong and unmovable, just like the median's position when extreme values change.
Summary
The median is a fundamental measure of central tendency representing the middle value of an ordered dataset, essential for GRE Quantitative Reasoning success. Calculating the median requires ordering all values and identifying either the single middle value (for odd-sized datasets using position (n+1)/2) or the average of two middle values (for even-sized datasets using positions n/2 and (n/2)+1). The median's key advantage over the mean is its resistance to outliers, making it the preferred measure for skewed distributions or datasets with extreme values. GRE questions test median concepts through direct calculations, problems involving unknown values where the median provides constraints, and comparisons between median and mean. Success requires both procedural fluency in calculation and conceptual understanding of how the median behaves when values are added, removed, or changed. Students must recognize that the median depends only on the order and middle position(s) of values, not on the magnitude of extreme values, and that changing values above or below the median (while maintaining their relative position) leaves the median unchanged. Mastery of median concepts enables accurate, efficient problem-solving across various Data Analysis question formats on the GRE.
Key Takeaways
- The median is the middle value of an ordered dataset and must be calculated after arranging values from least to greatest
- For odd-sized datasets, the median is the single middle value; for even-sized datasets, it's the average of the two middle values
- The median is resistant to outliers and extreme values, making it more representative than the mean for skewed distributions
- When working with unknown values, use the median to establish constraints: values below the median position must be ≤ median, values above must be ≥ median
- Always count the number of values (n) and determine if it's odd or even before calculating the median
- Changing values that remain on the same side of the median (above or below) does not change the median itself
- GRE median questions frequently appear in Quantitative Comparison, Data Interpretation, and Problem Solving formats, testing both calculation and conceptual reasoning
Related Topics
Mean (Average): Understanding the mean provides essential contrast to the median, helping students recognize when each measure is most appropriate and how they behave differently with outliers. Mastering median enables more sophisticated comparisons between these central tendency measures.
Mode: The third major measure of central tendency, representing the most frequently occurring value. Together with median and mean, mode completes the foundational toolkit for describing dataset centers.
Range and Interquartile Range: These measures of spread complement the median by describing data variability. The median serves as the foundation for understanding quartiles and the interquartile range.
Percentiles and Quartiles: The median is the 50th percentile and second quartile, making median mastery essential for understanding these more advanced positional measures.
Standard Deviation: This measure of spread around the mean contrasts with the median's role as a positional measure, deepening understanding of how different statistics capture different aspects of data distributions.
Box Plots and Data Visualization: These graphical representations prominently feature the median as a central component, requiring solid median understanding for interpretation.
Practice CTA
Now that you've mastered the core concepts, properties, and strategies for median problems, it's time to solidify your understanding through active practice. Attempt the practice questions designed specifically for this topic, focusing on applying the step-by-step calculation process and recognizing the various ways the GRE tests median concepts. Use the flashcards to reinforce key facts, formulas, and distinctions between median and other measures of central tendency. Remember: understanding the theory is just the first step—consistent practice with GRE-style questions transforms knowledge into the quick, accurate performance that leads to top scores. You've built a strong foundation; now strengthen it through deliberate practice!
Sign up free to keep reading
Create a free AnvayaPrep account to finish this GRE guide on Median — plus flashcards and practice questions.