Overview
The range is one of the most fundamental measures of variability in statistics and data analysis, representing the difference between the maximum and minimum values in a dataset. On the GRE Quantitative Reasoning section, understanding range is essential for interpreting data distributions, analyzing charts and graphs, and solving problems involving data sets. While the concept itself is straightforward—simply subtracting the smallest value from the largest—the GRE range questions often embed this calculation within more complex scenarios that test your ability to recognize when range is relevant and how it interacts with other statistical measures.
Range appears frequently in GRE Data Analysis questions, particularly in problems involving data interpretation, set comparisons, and questions about how adding or removing values affects a dataset's characteristics. The GRE tests not just your ability to calculate range mechanically, but your understanding of what range reveals about data spread, how it differs from other measures of variability like standard deviation, and how changes to a dataset impact the range. Questions may present data in tables, charts, or word problems, requiring you to identify the relevant values and perform the calculation accurately under time pressure.
Mastering range is foundational for understanding more sophisticated statistical concepts tested on the GRE, including quartiles, interquartile range, standard deviation, and data distribution patterns. Range serves as the simplest measure of spread, providing a baseline for understanding how data points are distributed across a spectrum. This topic connects directly to mean, median, and mode discussions, as well as to graphical data interpretation questions where you must extract maximum and minimum values from visual representations. A solid grasp of range enables you to quickly assess data variability and make informed comparisons between datasets—skills that are highly valued throughout the Quantitative Reasoning section.
Learning Objectives
- [ ] Identify when Range is being tested in GRE questions
- [ ] Explain the core rule or strategy behind Range calculations
- [ ] Apply Range to GRE-style questions accurately
- [ ] Determine how adding or removing data points affects the range of a dataset
- [ ] Compare range with other measures of variability and explain when range is most informative
- [ ] Extract maximum and minimum values from various data representations (tables, graphs, word problems)
- [ ] Solve multi-step problems where range calculation is one component of a larger question
Prerequisites
- Basic arithmetic operations: Subtraction is the fundamental operation for calculating range, and accuracy with negative numbers is essential when datasets include negative values
- Understanding of data sets: Familiarity with how collections of numbers are organized and represented is necessary to identify the relevant values for range calculation
- Number line concepts: Visualizing values on a number line helps understand range as a measure of spread and distance between extreme values
- Basic statistical terminology: Knowledge of terms like maximum, minimum, and dataset ensures comprehension of range-related questions
Why This Topic Matters
Range is a practical statistical measure used extensively in real-world contexts, from analyzing temperature variations and stock price fluctuations to understanding test score distributions and quality control in manufacturing. In business, range helps assess risk and volatility; in science, it provides a quick measure of experimental variability; in everyday life, it helps compare options (like price ranges when shopping or temperature ranges when planning travel). Understanding range develops quantitative literacy that extends far beyond standardized testing.
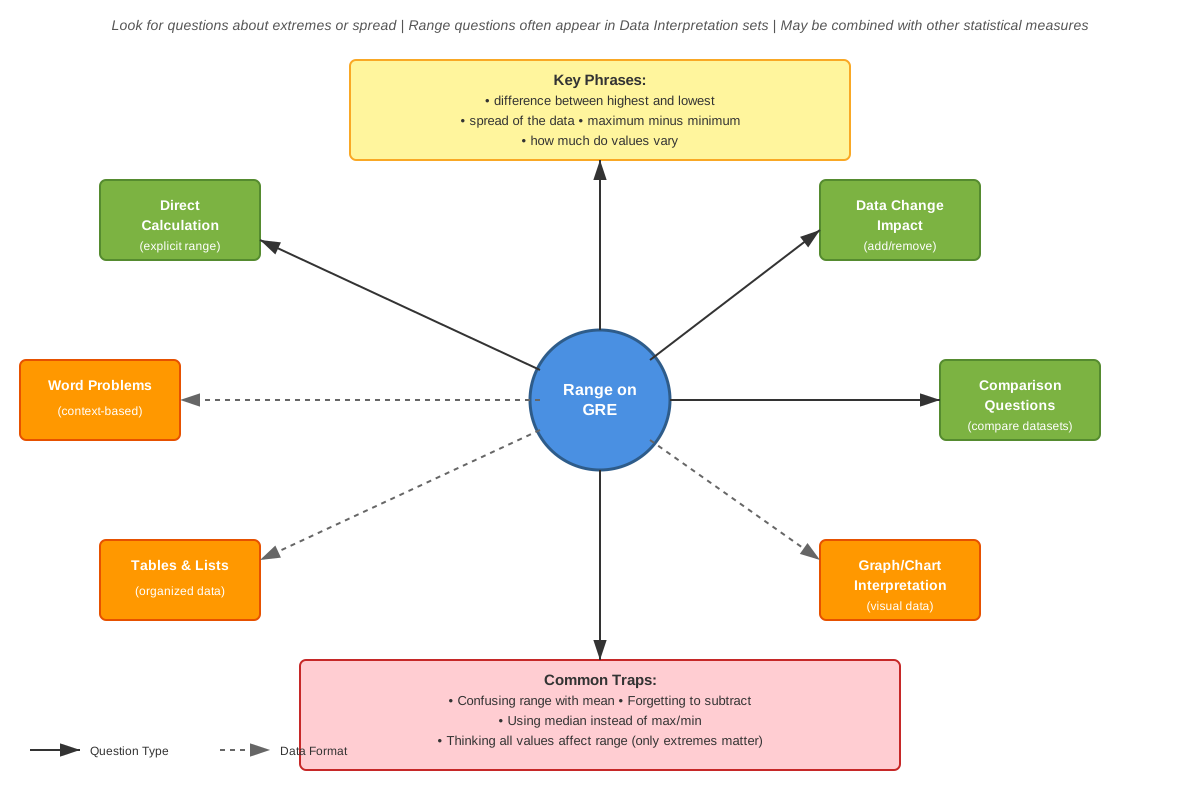
On the GRE, range appears in approximately 10-15% of Data Analysis questions, making it a high-yield topic for test preparation. Range questions typically appear in three formats: direct calculation problems where you compute range from a given dataset; data interpretation questions where you extract values from charts or tables before calculating range; and conceptual questions that test your understanding of how range changes when data is modified. The GRE particularly favors questions that combine range with other statistical measures or that require you to determine possible values that would produce a specific range.
Common GRE question patterns include: comparing ranges across multiple datasets presented in tables; determining how outliers affect range versus other measures like mean; identifying which data point removal would most impact range; and solving for unknown values given constraints on range. The test also frequently presents scenarios where you must recognize that range is the appropriate measure to use, testing your conceptual understanding rather than just computational ability. Questions may appear in Quantitative Comparison format, where you compare ranges of different sets, or in Problem Solving format, where range calculation is embedded within a multi-step problem.
Core Concepts
Definition and Basic Calculation
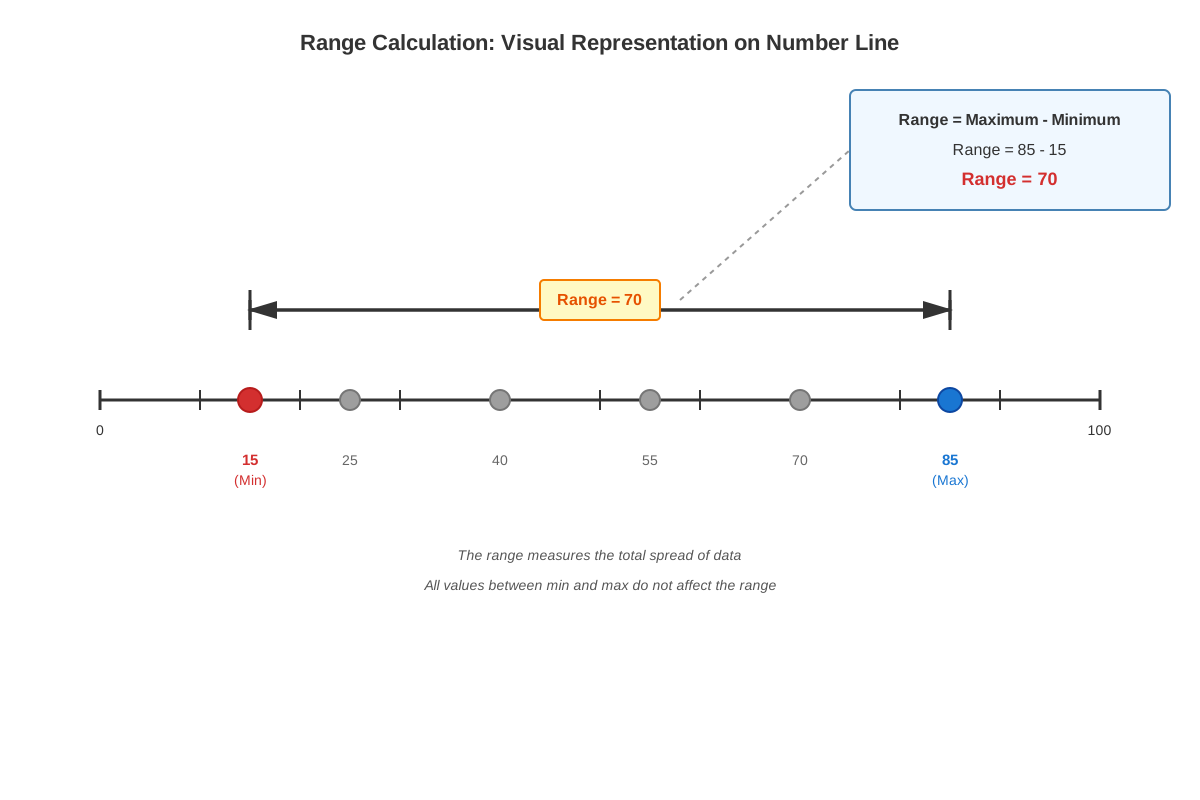
The range of a dataset is defined as the difference between the maximum (largest) value and the minimum (smallest) value in that set. The formula is elegantly simple:
Range = Maximum Value - Minimum ValueFor example, in the dataset {3, 7, 2, 9, 5}, the maximum value is 9 and the minimum value is 2, so the range is 9 - 2 = 7. This single number tells us that the data spans 7 units from the smallest to largest observation. Importantly, range is always non-negative; even if your dataset contains negative numbers, the range itself represents a distance and cannot be negative.
When working with negative numbers, careful attention to arithmetic is essential. Consider the dataset {-5, -2, 3, 8, 1}. The maximum is 8 and the minimum is -5, so the range is 8 - (-5) = 8 + 5 = 13. A common error is forgetting to account for the sign change when subtracting a negative number. The range of 13 indicates that the data spans 13 units on the number line from -5 to 8.
Range as a Measure of Variability
Range serves as the simplest measure of variability or spread in a dataset, indicating how dispersed the values are. A small range suggests that data points cluster closely together, while a large range indicates greater dispersion. However, range has significant limitations as a variability measure because it depends entirely on just two values—the extremes—and ignores all intermediate data points.
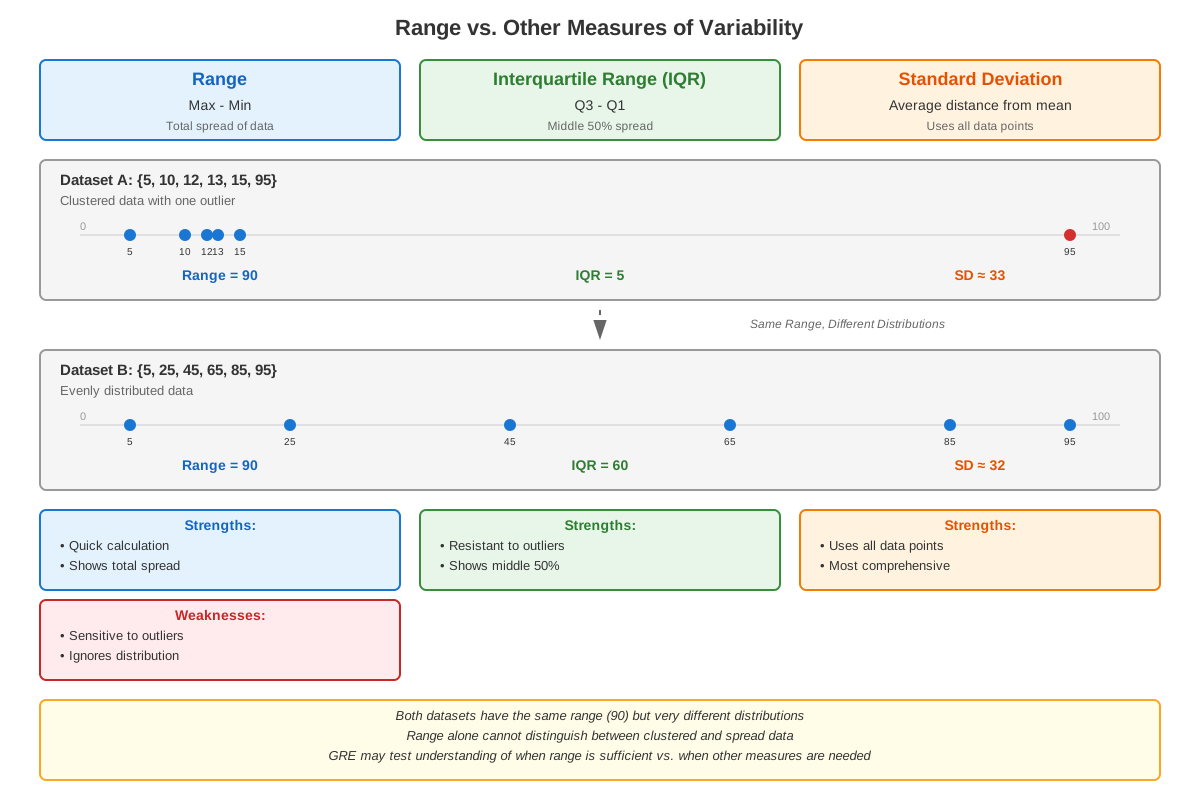
Consider two datasets: Set A = {1, 2, 3, 4, 5} and Set B = {1, 1, 3, 5, 5}. Both have a range of 4 (5 - 1 = 4), yet their distributions are quite different. Set A has evenly spaced values, while Set B has values clustered at the extremes. This illustrates why range alone provides incomplete information about data distribution. The GRE exploits this limitation by asking questions that require you to distinguish between range and more sophisticated measures like standard deviation or interquartile range.
Impact of Data Changes on Range
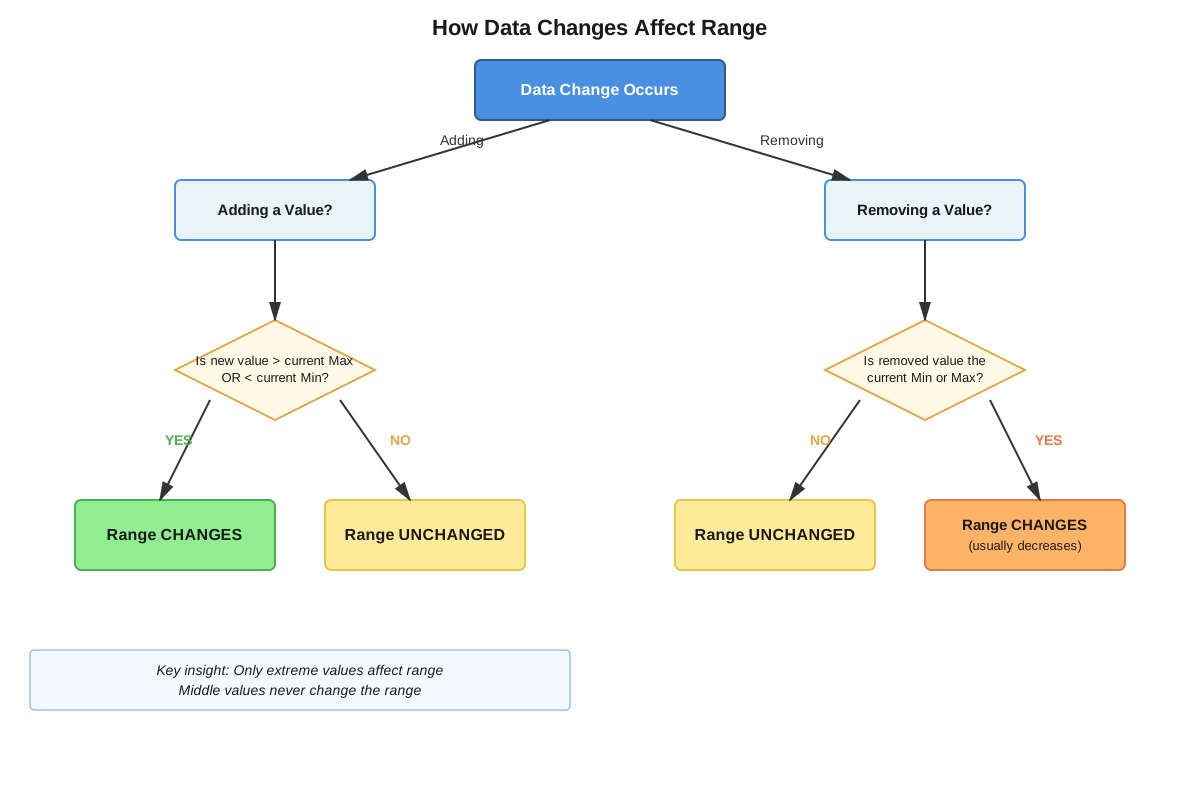
Understanding how adding, removing, or modifying data points affects range is crucial for GRE success. The range changes only when the maximum or minimum value changes. Adding a value between the current minimum and maximum does not affect range, but adding a value outside this interval will increase the range.
| Action | Effect on Range |
|---|---|
| Add value between min and max | No change |
| Add value greater than current max | Increases (new max - old min) |
| Add value less than current min | Increases (old max - new min) |
| Remove the maximum value | Decreases or stays same (depends on next largest value) |
| Remove the minimum value | Decreases or stays same (depends on next smallest value) |
| Remove a middle value | No change |
| Multiply all values by positive constant k | Range multiplied by k |
| Add constant c to all values | No change |
The last two rows reveal important properties: scaling data by multiplication scales the range proportionally, while shifting data by addition or subtraction leaves range unchanged. If every value in a dataset is increased by 10, the maximum and minimum both increase by 10, so their difference (the range) remains constant. However, if every value is doubled, both the maximum and minimum double, so the range also doubles.
Range in Different Data Representations
GRE questions present data in various formats, and extracting the maximum and minimum values requires different approaches for each:
Numerical lists: Scan the entire list to identify the largest and smallest values. Don't assume the data is ordered; GRE questions often present unsorted data to test careful reading.
Frequency tables: Identify which values actually appear in the dataset (those with non-zero frequency), then determine the maximum and minimum among these values. The range depends on which values are present, not their frequencies.
Bar charts and histograms: The range spans from the lowest category or bin with non-zero frequency to the highest. For histograms with intervals, you may need to use interval boundaries rather than specific values.
Line graphs: Identify the highest and lowest points on the graph. Be careful to read the scale accurately and distinguish between data points and the connecting lines.
Box plots: The range is represented by the distance from the minimum whisker endpoint to the maximum whisker endpoint (excluding outliers marked separately, unless the question specifies otherwise).
Range Versus Other Measures
Understanding how range compares to other statistical measures helps you choose the appropriate tool for analysis and answer conceptual GRE questions:
Range vs. Interquartile Range (IQR): While range measures the spread of all data, IQR measures the spread of the middle 50% of data (Q3 - Q1). IQR is resistant to outliers, whereas range is highly sensitive to extreme values. A single outlier can dramatically increase range while leaving IQR unchanged.
Range vs. Standard Deviation: Standard deviation considers how far each data point deviates from the mean, providing a more comprehensive measure of spread than range. Two datasets with identical ranges can have vastly different standard deviations depending on how the intermediate values are distributed.
Range vs. Mean Absolute Deviation: Like standard deviation, mean absolute deviation considers all data points, not just extremes, making it more informative about overall variability than range.
The GRE often tests whether you understand these distinctions through questions like: "Which measure of variability would be most affected by removing the largest value?" (Answer: range and standard deviation, but not IQR if the largest value isn't near Q3).
Concept Relationships
The concepts within range form a logical progression: the basic definition and calculation method → understanding range as a variability measure → recognizing how data changes affect range → applying range across different data representations → comparing range with alternative measures. Each concept builds on the previous, moving from mechanical computation to conceptual understanding to strategic application.
Range connects to prerequisite topics through its reliance on basic arithmetic (particularly subtraction with negative numbers) and understanding of datasets and ordering. The ability to identify maximum and minimum values requires comfort with number line concepts and inequality relationships. These foundational skills enable accurate range calculation regardless of how the data is presented.
Range serves as a gateway to more advanced statistical concepts tested on the GRE. Understanding range → leads to → understanding interquartile range (which is the range of the middle 50% of data) → leads to → understanding box plots (which visually represent range, quartiles, and IQR) → leads to → understanding outlier detection (which often involves comparing values to range-based or IQR-based thresholds). Similarly, recognizing range's limitations → motivates → learning about standard deviation and variance → which leads to → understanding normal distributions and z-scores.
The relationship map for range within Data Analysis:
Basic arithmetic and ordering → Range calculation → Measures of variability (range, IQR, standard deviation) → Data distribution analysis → Box plots and graphical representations → Outlier identification → Comparative data analysis
Quick check — test yourself on Range so far.
Try Flashcards →High-Yield Facts
⭐ Range equals maximum value minus minimum value; it is always non-negative
⭐ Range changes only when the maximum or minimum value changes; adding or removing middle values has no effect
⭐ Adding the same constant to all values in a dataset does not change the range
⭐ Multiplying all values by a positive constant k multiplies the range by k
⭐ Range is highly sensitive to outliers, unlike interquartile range which is resistant to extreme values
- Range measures the spread of an entire dataset but provides no information about the distribution of intermediate values
- Two datasets with identical ranges can have completely different distributions and different values for mean, median, and standard deviation
- In a dataset with all identical values, the range is zero
- Range can be calculated from frequency tables by identifying the smallest and largest values that have non-zero frequency
- When comparing ranges across multiple datasets, ensure you're using the same units and scales
- For grouped data or histograms, range is typically calculated using the boundaries of the lowest and highest intervals containing data
- Range is the simplest measure of variability to calculate but provides the least information about data distribution
- A dataset with a large range relative to its mean indicates high variability; a small range relative to the mean indicates low variability
- Range cannot be negative, but datasets can contain negative numbers; the range represents the distance between extremes
- On the GRE, range questions often combine with other statistical concepts, requiring multi-step reasoning
Common Misconceptions
Misconception: Range is calculated by adding the maximum and minimum values.
Correction: Range is the difference (subtraction) between maximum and minimum values, not their sum. The range represents the spread or distance between extremes, which requires subtraction.
Misconception: Adding a constant to all values in a dataset changes the range.
Correction: Adding (or subtracting) the same constant to every value shifts the entire dataset but doesn't change the spread between values. If the original range was max - min, after adding c to each value, the new range is (max + c) - (min + c) = max - min, which is unchanged.
Misconception: Range provides complete information about data variability.
Correction: Range only considers the two extreme values and ignores all intermediate data points. Two datasets with identical ranges can have vastly different distributions. Range is the least informative measure of variability, which is why statisticians often prefer standard deviation or IQR.
Misconception: The range of a dataset containing negative numbers can be negative.
Correction: Range represents a distance or spread and is always non-negative. Even if your dataset is {-10, -5, -2}, the range is -2 - (-10) = 8, which is positive. The range measures how far apart the values are, not their actual positions on the number line.
Misconception: Removing any value from a dataset will decrease the range.
Correction: Range only decreases (or stays the same) when you remove the maximum or minimum value. Removing any value between these extremes leaves the range unchanged because the maximum and minimum remain the same.
Misconception: In a frequency table, range is calculated using all listed values regardless of frequency.
Correction: Range should only consider values that actually appear in the dataset (those with non-zero frequency). If a frequency table lists values 1, 2, 3, 4, 5 but value 5 has frequency 0, then 5 is not in the dataset and should not be used as the maximum when calculating range.
Misconception: Doubling all values in a dataset doubles the range, and adding 10 to all values increases the range by 10.
Correction: This is backwards. Multiplying all values by a constant k multiplies the range by k (so doubling all values does double the range), but adding a constant to all values leaves the range unchanged (so adding 10 to all values doesn't change the range at all).
Worked Examples
Example 1: Multi-Step Range Problem with Data Modification
Problem: A dataset consists of five test scores: 72, 85, 90, 78, and 88. If the lowest score is replaced with a score of 80, and then a sixth score of 95 is added to the dataset, what is the range of the new dataset?
Solution:
Step 1: Identify the original dataset and its extremes.
Original dataset: {72, 85, 90, 78, 88}
Original minimum: 72
Original maximum: 90
Original range: 90 - 72 = 18
Step 2: Apply the first modification (replace lowest score with 80).
The lowest score (72) is replaced with 80.
Modified dataset: {80, 85, 90, 78, 88}
New minimum: 78 (not 80, because 78 is still in the dataset)
Maximum remains: 90
Range after first modification: 90 - 78 = 12
Step 3: Apply the second modification (add score of 95).
Final dataset: {80, 85, 90, 78, 88, 95}
Minimum remains: 78
New maximum: 95 (this is now the largest value)
Final range: 95 - 78 = 17
Answer: The range of the new dataset is 17.
Key insights: This problem tests multiple learning objectives: accurately calculating range, understanding how data modifications affect range, and recognizing that you must re-evaluate the minimum and maximum after each change. A common error would be assuming the minimum becomes 80 after the first modification, forgetting that 78 is still in the dataset.
Example 2: Range in Data Interpretation with Constraints
Problem: A company tracks daily sales over a week. The sales figures (in thousands of dollars) are: 12, 15, x, 18, 14, 20, 16, where x represents Wednesday's sales. If the range of the weekly sales is 10 thousand dollars, what are the possible values of x?
Solution:
Step 1: Identify known values and their extremes.
Known values: {12, 15, 18, 14, 20, 16}
Current maximum (excluding x): 20
Current minimum (excluding x): 12
Current range (excluding x): 20 - 12 = 8
Step 2: Analyze how x affects the range.
We're told the range including x must be 10.
Since the current range without x is 8, and we need a range of 10, x must extend the range by creating a new maximum or minimum.
Step 3: Consider Case 1 - x creates a new maximum.
If x > 20, then range = x - 12 = 10
Solving: x = 22
Step 4: Consider Case 2 - x creates a new minimum.
If x < 12, then range = 20 - x = 10
Solving: 20 - x = 10, so x = 10
Step 5: Consider Case 3 - x is between current min and max.
If 12 ≤ x ≤ 20, then the range remains 20 - 12 = 8, which doesn't satisfy our requirement.
Therefore, x cannot be in this interval.
Step 6: Verify the solutions.
If x = 22: Dataset is {12, 15, 22, 18, 14, 20, 16}, range = 22 - 12 = 10 ✓
If x = 10: Dataset is {12, 15, 10, 18, 14, 20, 16}, range = 20 - 10 = 10 ✓
Answer: The possible values of x are 10 or 22 (thousand dollars).
Key insights: This problem demonstrates how range constraints can be used to solve for unknown values. It requires understanding that range changes only when extremes change, and that there can be multiple solutions depending on whether the unknown value becomes a new maximum or minimum. This type of problem frequently appears on the GRE in Quantitative Comparison or Problem Solving formats.
Exam Strategy
When approaching GRE range questions, begin by identifying whether the question asks for direct calculation, conceptual understanding, or application within a larger problem. Look for trigger words such as "range," "spread," "difference between highest and lowest," "maximum minus minimum," or "how far apart are the values." Questions may also implicitly test range by asking about "variability" or "dispersion" and requiring you to choose the appropriate measure.
Process-of-elimination strategies for range questions:
- Eliminate answers that violate basic properties: Range cannot be negative, so eliminate any negative answer choices immediately. Range cannot exceed the difference between the largest and smallest values you can identify, so eliminate answers that are too large.
- Check extreme cases: If a question asks how adding a value affects range, test the extreme scenarios (adding a value much larger than the current max, or much smaller than the current min) to eliminate impossible answers.
- Verify with simple calculations: If answer choices are numerical, quickly calculate the range using the most obvious maximum and minimum to eliminate clearly wrong answers before considering complications.
- Watch for unit consistency: Ensure all values are in the same units before calculating range. GRE questions sometimes present data in mixed units (e.g., some values in dollars, others in cents) to test careful reading.
Time allocation advice: Simple range calculations should take 30-45 seconds. Data interpretation questions requiring you to extract values from charts or tables before calculating range may take 60-90 seconds. Multi-step problems involving range as one component of a larger question may require 2-3 minutes. If you find yourself spending more than 3 minutes on a range question, mark it for review and move on—you may be overcomplicating the problem.
Strategic approaches for common question types:
- Quantitative Comparison with ranges: Calculate each range separately, but look for shortcuts. If one dataset clearly has a larger maximum and smaller minimum than another, you can determine which has the larger range without calculating exact values.
- Data sufficiency with range: Remember that to determine range, you need to know both the maximum and minimum values. One statement giving you the maximum and another giving you the minimum would together be sufficient.
- Questions about data modification: Systematically track how each modification affects the maximum and minimum, rather than trying to visualize the entire dataset changing.
Exam Tip: If a question presents a large dataset, don't waste time ordering all values. Simply scan for the maximum and minimum—that's all you need for range calculation.
Memory Techniques
Mnemonic for range properties: "Range Requires Removing Regular values has Really Really Really no effect" - This reminds you that range only changes when extreme values (not regular middle values) are removed.
Visualization strategy: Picture range as a rubber band stretched between the minimum and maximum values on a number line. Adding values in the middle doesn't stretch the band further (no change in range), but adding values beyond the current endpoints does stretch it (increases range). This mental image helps you quickly determine whether adding or removing values will affect range.
Acronym for range vs. other measures: "Range Ignores Middle" (RIM) - This reminds you that range only considers extremes and ignores all middle values, which is its key limitation compared to measures like standard deviation that consider all data points.
Memory aid for transformation effects: "Add Same, Same range" and "Multiply All, Multiply range" (ASS-MAM) - Adding the same constant to all values keeps the same range; multiplying all values multiplies the range. While the acronym is silly, that makes it memorable.
Conceptual anchor: Always remember that range measures "how far apart" the data spreads, not "how much data" or "where the data is centered." This conceptual anchor helps you distinguish range from other measures like mean (which measures center) or count (which measures quantity).
Summary
Range is the simplest and most intuitive measure of data variability, calculated as the difference between the maximum and minimum values in a dataset. While straightforward in concept, GRE range questions test deeper understanding by embedding calculations within data interpretation tasks, asking how data modifications affect range, and requiring you to distinguish range from other variability measures. The key to mastering range is recognizing that it depends entirely on just two values—the extremes—making it highly sensitive to outliers but insensitive to changes in middle values. Understanding that adding constants to all values leaves range unchanged while multiplying by constants scales the range proportionally is essential for solving transformation problems. Range appears frequently on the GRE in various formats including direct calculation, data interpretation from charts and tables, and conceptual questions about statistical properties. Success requires not just computational accuracy but also strategic thinking about when range is the appropriate measure to use and how it relates to other statistical concepts like interquartile range and standard deviation.
Key Takeaways
- Range = Maximum - Minimum; it measures the spread between extreme values and is always non-negative
- Range changes only when the maximum or minimum value changes; adding or removing middle values has no effect
- Adding the same constant to all values leaves range unchanged; multiplying all values by constant k multiplies range by k
- Range is highly sensitive to outliers and provides no information about the distribution of intermediate values
- On the GRE, range questions often combine with other statistical concepts and require careful extraction of maximum and minimum values from various data representations
- Understanding range's limitations compared to other variability measures (IQR, standard deviation) is essential for conceptual questions
- Strategic scanning for extremes rather than ordering entire datasets saves valuable time on the exam
Related Topics
Interquartile Range (IQR): Building on range concepts, IQR measures the spread of the middle 50% of data (Q3 - Q1), providing a measure resistant to outliers. Mastering range enables understanding of IQR as a "range of the middle portion" of data.
Box Plots: These graphical representations visually display range (from minimum to maximum whisker), quartiles, and IQR. Understanding range is prerequisite to interpreting box plots effectively.
Standard Deviation and Variance: These more sophisticated measures of variability consider all data points, not just extremes. Comparing range to standard deviation deepens understanding of when each measure is most appropriate.
Outlier Detection: Many outlier identification methods involve comparing values to range-based or IQR-based thresholds. Understanding range provides foundation for these techniques.
Data Distribution Analysis: Range is one component of describing how data is distributed. Combining range with measures of central tendency (mean, median) provides comprehensive data characterization.
Practice CTA
Now that you've mastered the concepts, properties, and strategies for range, it's time to solidify your understanding through active practice. Attempt the practice questions to apply these concepts to GRE-style problems, and use the flashcards to reinforce key facts and formulas. Remember, understanding range is not just about memorizing a formula—it's about developing the strategic thinking to recognize when and how range is tested, and the flexibility to apply this knowledge across diverse question formats. Your investment in mastering this high-yield topic will pay dividends throughout the Data Analysis section and beyond. You've got this!
Sign up free to keep reading
Create a free AnvayaPrep account to finish this GRE guide on Range — plus flashcards and practice questions.