Overview
The mode is one of the three fundamental measures of central tendency in statistics, alongside the mean and median. In the context of GRE mode questions, understanding this concept is essential for success on Data Analysis problems, which constitute approximately 15-20% of the Quantitative Reasoning section. The mode represents the value that appears most frequently in a dataset, making it a straightforward yet powerful tool for describing data distributions.
On the GRE, mode questions often appear in multiple formats: as standalone quantitative comparison problems, within data interpretation sets featuring tables or graphs, or embedded in word problems requiring statistical reasoning. Unlike the mean, which can be skewed by outliers, or the median, which requires ordering data, the mode provides immediate insight into the most common occurrence in a dataset. This makes it particularly valuable when analyzing categorical data or identifying patterns in frequency distributions.
Mastery of mode concepts connects directly to broader Quantitative Reasoning skills, including data interpretation, set theory, and probability. The GRE frequently tests whether students can distinguish between different measures of central tendency, recognize when datasets have no mode or multiple modes, and apply mode concepts to real-world scenarios. Understanding mode also builds foundational knowledge for more advanced statistical concepts that may appear in graduate-level coursework, making this topic both immediately practical for test success and valuable for future academic work.
Learning Objectives
- [ ] Identify when Mode is being tested in GRE questions
- [ ] Explain the core rule or strategy behind Mode calculations
- [ ] Apply Mode to GRE-style questions accurately
- [ ] Distinguish between unimodal, bimodal, multimodal, and datasets with no mode
- [ ] Compare and contrast mode with mean and median in various data distributions
- [ ] Analyze how changes to a dataset affect the mode
- [ ] Solve complex problems involving mode in conjunction with other statistical measures
Prerequisites
- Basic arithmetic operations: Essential for counting frequencies and comparing values when determining which number appears most often
- Understanding of data sets and lists: Required to organize and analyze collections of numbers or categories
- Familiarity with mean and median: Provides context for understanding mode as one of three measures of central tendency
- Basic graphical interpretation: Necessary for extracting data from tables, bar charts, and frequency distributions where mode questions commonly appear
Why This Topic Matters
The mode has significant real-world applications across diverse fields. In business, companies use mode to identify the most popular product size, the most common customer complaint, or the typical transaction amount. In education, mode helps identify the most frequent test score, revealing where the majority of students perform. In manufacturing, mode indicates the most common defect type or the standard production output. These practical applications make mode questions on the GRE both realistic and relevant to graduate-level research and professional work.
On the GRE, mode appears in approximately 3-5 questions per test administration, either directly or as part of multi-step data analysis problems. The test makers favor mode questions because they efficiently assess multiple skills: data interpretation, logical reasoning, and the ability to distinguish between similar statistical concepts. Mode questions typically appear in three formats: quantitative comparison questions asking students to compare mode with other measures, problem-solving questions requiring mode calculation from datasets or frequency tables, and data interpretation sets where students must extract information from graphs or charts to determine the mode.
Common exam scenarios include: identifying the mode from a list of numbers; determining how adding or removing values affects the mode; recognizing when a dataset has multiple modes or no mode; comparing mode to mean or median; and interpreting mode from visual representations like histograms or bar graphs. The GRE particularly favors questions that test whether students understand the conceptual differences between measures of central tendency rather than just computational ability.
Core Concepts
Definition of Mode
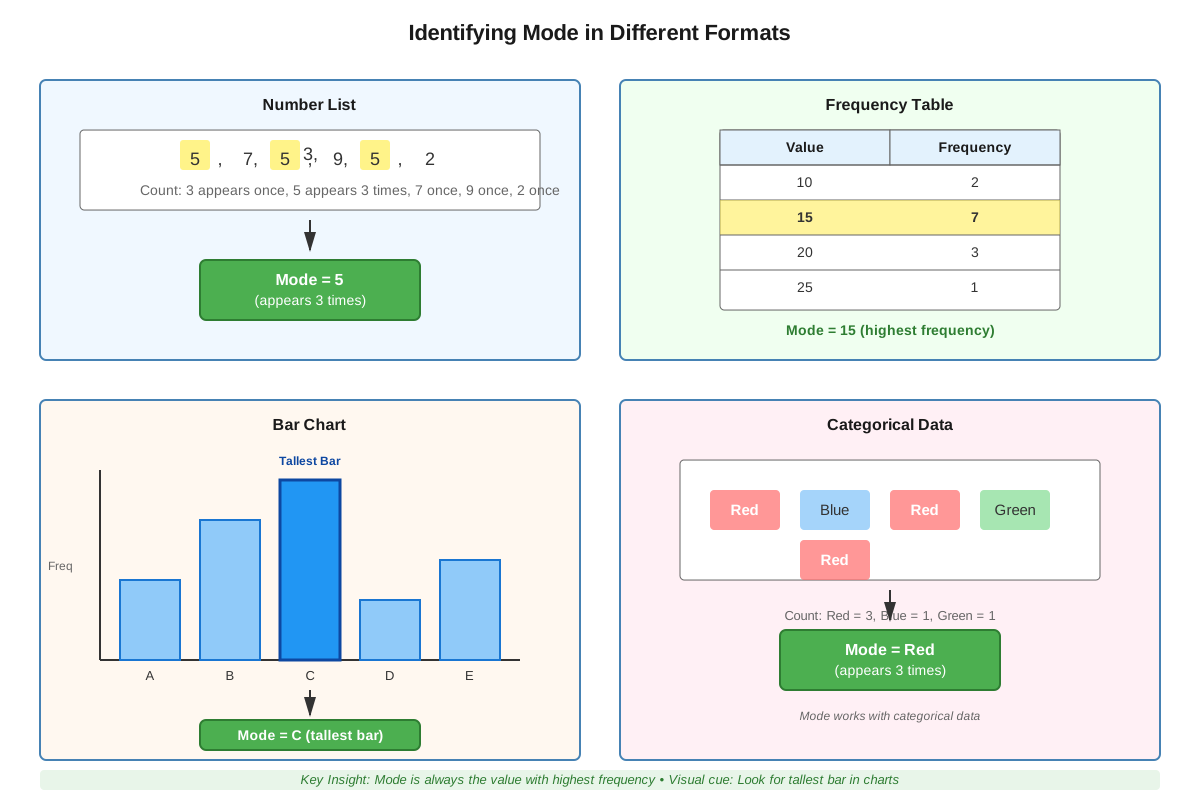
The mode is defined as the value that appears most frequently in a dataset. Unlike mean and median, which always produce a single numerical result (when they exist), a dataset can have one mode, multiple modes, or no mode at all. To find the mode, count how many times each distinct value appears in the dataset and identify the value(s) with the highest frequency.
For example, in the dataset {2, 3, 3, 5, 7, 7, 7, 9}, the number 7 appears three times, more than any other value, making 7 the mode. The mode is the only measure of central tendency that can be used with categorical (non-numerical) data, such as determining the most popular color choice or the most common brand preference.
Types of Modal Distributions
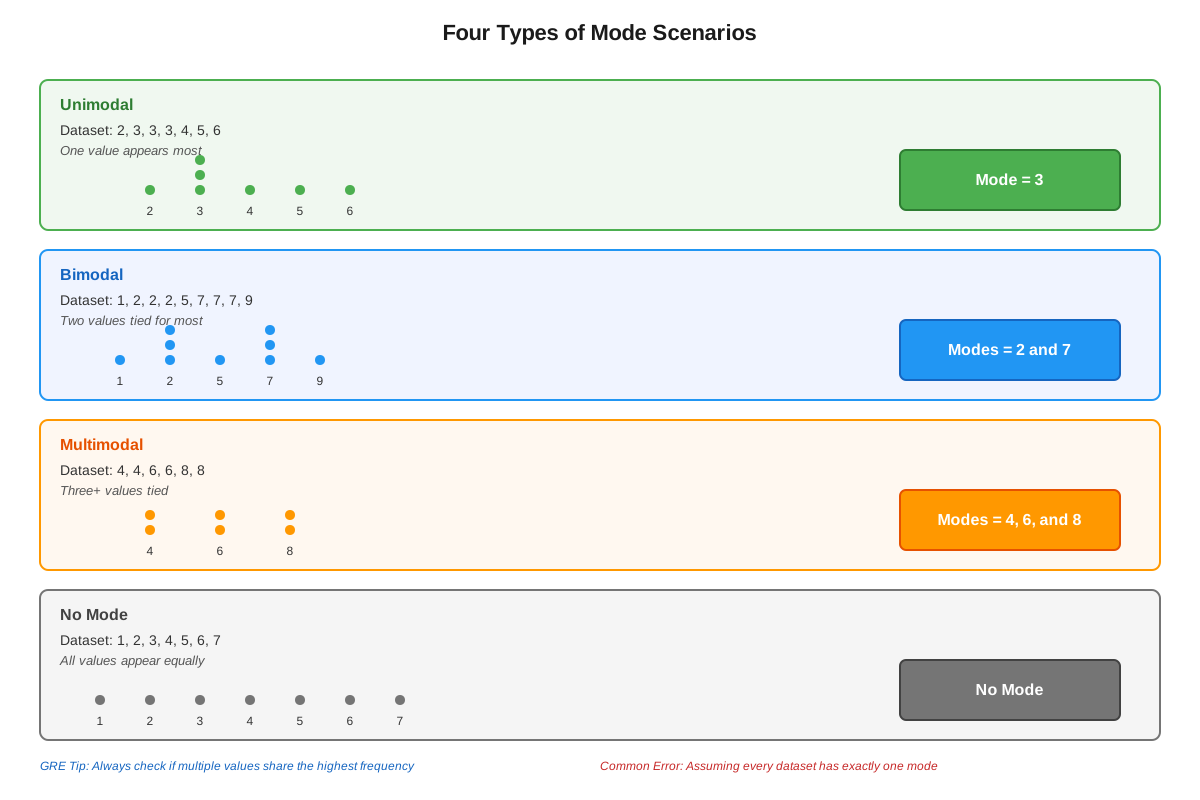
Understanding the different types of modal distributions is crucial for GRE success:
Unimodal Distribution: A dataset with exactly one mode. Example: {1, 2, 2, 2, 3, 4, 5} has mode = 2. This is the most common scenario on the GRE and represents datasets where one value clearly dominates in frequency.
Bimodal Distribution: A dataset with exactly two modes. Example: {1, 1, 1, 2, 3, 4, 4, 4, 5} has modes = 1 and 4. Both values appear three times, which is more frequent than any other value. Bimodal distributions often indicate two distinct groups or patterns within the data.
Multimodal Distribution: A dataset with three or more modes. Example: {2, 2, 3, 3, 5, 5, 7} has modes = 2, 3, and 5. While less common on the GRE, recognizing multimodal distributions demonstrates sophisticated understanding.
No Mode (Uniform Distribution): A dataset where all values appear with equal frequency. Example: {1, 2, 3, 4, 5} has no mode because each value appears exactly once. This scenario frequently appears in GRE trap answers, as students may incorrectly assume every dataset must have a mode.
Mode vs. Mean vs. Median
Understanding the distinctions between these three measures of central tendency is high-yield for the GRE:
| Measure | Definition | Affected by Outliers? | Works with Categorical Data? | Always Unique? |
|---|---|---|---|---|
| Mode | Most frequent value | No | Yes | No (can have 0, 1, or many) |
| Mean | Arithmetic average | Yes | No | Yes |
| Median | Middle value when ordered | Minimal | No | Yes (or average of two middle values) |
The mode's resistance to outliers makes it particularly useful for skewed distributions. Consider the dataset {1, 2, 2, 2, 3, 100}. The mean is approximately 18.3, heavily influenced by the outlier 100. The median is 2. The mode is also 2, accurately representing the most typical value without distortion from the extreme value.
Calculating Mode from Frequency Tables
GRE questions frequently present data in frequency tables rather than as raw lists. To find the mode from a frequency table:
- Identify the row or category with the highest frequency count
- The corresponding value is the mode
- Check for ties (multiple categories with the same highest frequency)
Example frequency table:
| Score | Frequency |
|---|---|
| 70 | 3 |
| 75 | 7 |
| 80 | 7 |
| 85 | 4 |
| 90 | 2 |
This dataset is bimodal with modes at 75 and 80, since both scores appear 7 times.
Mode in Grouped Data and Histograms
When data is presented in ranges or intervals (grouped data), the modal class is the interval with the highest frequency. For example, if a histogram shows that the 20-30 age range has more individuals than any other age range, then 20-30 is the modal class. Note that this doesn't identify a specific mode value, only the range containing the most observations.
How Changes Affect Mode
Understanding how modifications to a dataset affect the mode is a favorite GRE testing point:
- Adding a value that already exists: If you add another instance of the current mode, the mode remains unchanged
- Adding a value that doesn't exist: If the new value appears fewer times than the current mode, the mode remains unchanged
- Adding multiple instances of a new value: Can create a new mode or additional mode
- Removing the mode: If you remove all instances of the mode, a new mode emerges (or the dataset may have no mode)
- Changing a non-mode value: Generally doesn't affect the mode unless it creates a new frequency leader
Concept Relationships
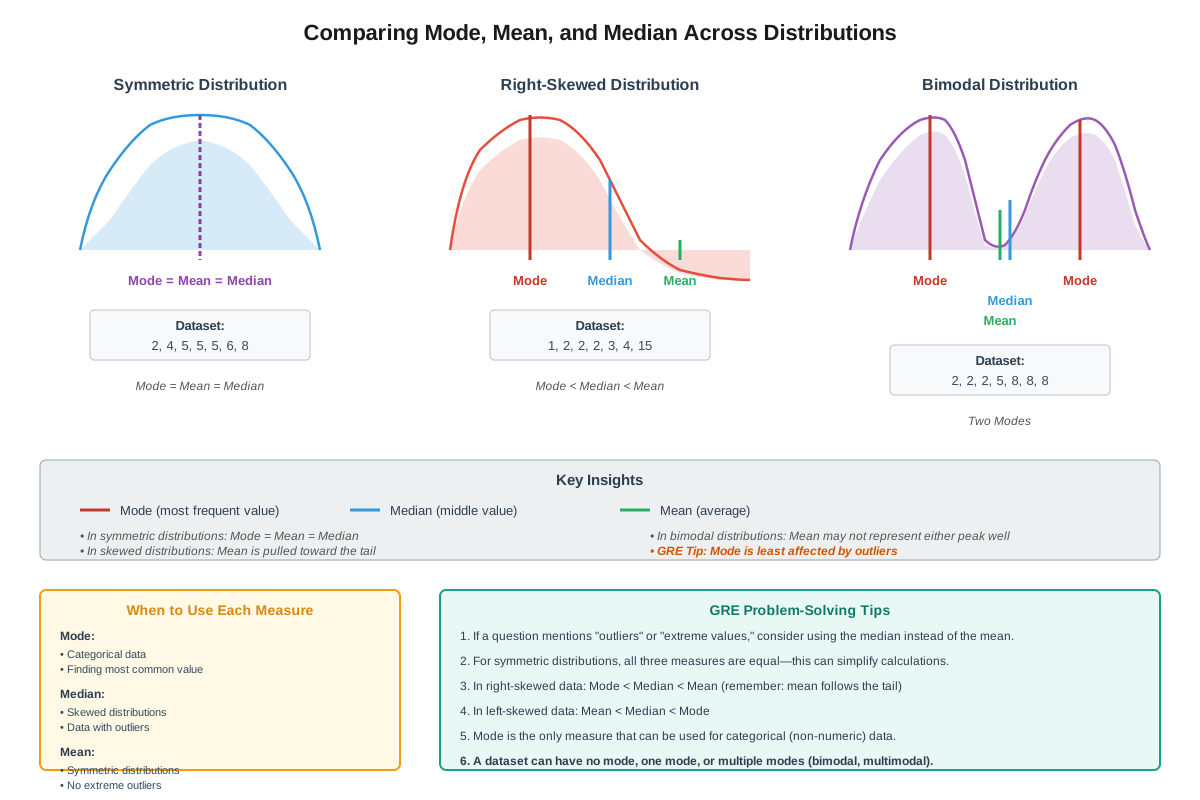
The mode functions as one vertex of the central tendency triangle, with mean and median forming the other two points. These three measures work together to provide a complete picture of data distribution. When all three measures are equal, the distribution is perfectly symmetrical. When they differ, their relationships reveal the distribution's shape: in right-skewed distributions, mode < median < mean; in left-skewed distributions, mean < median < mode.
Mode connects directly to frequency analysis, as determining mode requires counting occurrences. This links to probability concepts, since the mode represents the outcome with the highest probability in a discrete distribution. The relationship flows: Raw Data → Frequency Count → Mode Identification → Distribution Analysis.
Mode also relates to range and spread concepts. A dataset can have the same mode but vastly different ranges, illustrating that measures of central tendency and measures of variability provide complementary information. For example, {5, 5, 5, 6, 7} and {5, 5, 5, 100, 200} both have mode = 5, but dramatically different ranges.
Understanding mode enables progression to more advanced topics like standard deviation, percentiles, and data distribution shapes. The mode serves as an anchor point for understanding where data clusters, which is foundational for interpreting more sophisticated statistical measures.
High-Yield Facts
⭐ The mode is the only measure of central tendency that can be applied to categorical (non-numerical) data
⭐ A dataset can have zero modes, one mode, or multiple modes—there is no requirement that a mode must exist
⭐ The mode is not affected by extreme values (outliers) in the dataset
⭐ In a perfectly symmetrical distribution, the mean, median, and mode are all equal
⭐ Adding or removing values that are not the current mode typically does not change the mode
- A dataset where all values appear with equal frequency has no mode
- The mode of a frequency distribution is the value with the highest frequency count
- Bimodal distributions often indicate the presence of two distinct subgroups in the data
- The modal class in grouped data is the interval with the highest frequency, not a specific value
- Mode is particularly useful for describing the "typical" case in highly skewed distributions where mean would be misleading
- In a histogram, the mode corresponds to the tallest bar (highest frequency)
- The mode can be the same as the mean and median, but this is not required
Quick check — test yourself on Mode so far.
Try Flashcards →Common Misconceptions
Misconception: Every dataset must have a mode. → Correction: Datasets where all values appear with equal frequency have no mode. For example, {1, 2, 3, 4, 5} has no mode because each value appears exactly once.
Misconception: The mode is always the middle value in a dataset. → Correction: The middle value is the median, not the mode. The mode is the most frequently occurring value, regardless of its position. In {1, 5, 5, 5, 100}, the mode is 5, but the median is also 5 by coincidence, not by definition.
Misconception: A dataset can only have one mode. → Correction: Datasets can be bimodal (two modes) or multimodal (more than two modes). Any value that shares the highest frequency count is a mode.
Misconception: The mode must be near the center of the data. → Correction: The mode can be any value in the dataset, including extreme values. In {1, 1, 1, 50, 51, 52, 53, 54}, the mode is 1, which is at the lower extreme.
Misconception: The largest number in a dataset is the mode. → Correction: The mode is the most frequent value, not the largest value. In {2, 2, 2, 3, 9}, the mode is 2, not 9.
Misconception: Changing any value in a dataset will change the mode. → Correction: The mode only changes if the modification affects which value has the highest frequency. Changing a non-mode value to another non-mode value typically doesn't affect the mode.
Misconception: The mode is calculated by adding values and dividing. → Correction: That describes the mean. The mode is found by identifying which value appears most frequently—no arithmetic calculation is required.
Worked Examples
Example 1: Identifying Mode and Understanding Distribution Types
Problem: A teacher records the number of questions students answered correctly on a 10-question quiz: {6, 7, 7, 8, 8, 8, 8, 9, 9, 10}.
(a) What is the mode?
(b) If two students who scored 7 dropped the class and their scores were removed, what would be the new mode?
(c) If one additional student scored 9, would the dataset become bimodal?
Solution:
(a) Count the frequency of each value:
- 6 appears 1 time
- 7 appears 2 times
- 8 appears 4 times
- 9 appears 2 times
- 10 appears 1 time
The value 8 appears most frequently (4 times), so mode = 8.
(b) After removing two scores of 7, the dataset becomes: {6, 8, 8, 8, 8, 9, 9, 10}
New frequency count:
- 6 appears 1 time
- 8 appears 4 times
- 9 appears 2 times
- 10 appears 1 time
The value 8 still appears most frequently, so mode = 8 (unchanged).
This demonstrates that removing non-mode values doesn't affect the mode.
(c) After adding one score of 9, the dataset becomes: {6, 7, 7, 8, 8, 8, 8, 9, 9, 9, 10}
New frequency count:
- 6 appears 1 time
- 7 appears 2 times
- 8 appears 4 times
- 9 appears 3 times
- 10 appears 1 time
The value 8 still appears most frequently (4 times) while 9 appears only 3 times, so the dataset remains unimodal with mode = 8. For the dataset to become bimodal, 9 would need to appear 4 times, requiring one more student to score 9.
Learning Objective Connection: This example addresses identifying mode, applying mode calculations accurately, and analyzing how changes to datasets affect the mode.
Example 2: GRE-Style Quantitative Comparison
Problem:
Set A: {2, 4, 4, 6, 8, 10, 12}
Set B: {1, 3, 5, 7, 9, 11, 13}
Quantity A: The mode of Set A
Quantity B: The mode of Set B
(A) Quantity A is greater
(B) Quantity B is greater
(C) The two quantities are equal
(D) The relationship cannot be determined from the information given
Solution:
First, find the mode of Set A:
- 2 appears 1 time
- 4 appears 2 times
- 6 appears 1 time
- 8 appears 1 time
- 10 appears 1 time
- 12 appears 1 time
Mode of Set A = 4 (appears most frequently)
Next, find the mode of Set B:
- Each value (1, 3, 5, 7, 9, 11, 13) appears exactly 1 time
Set B has no mode because all values appear with equal frequency.
When comparing a numerical value (4) to a non-existent mode, we cannot make a meaningful comparison. The answer is (D): The relationship cannot be determined.
Key Insight: This question tests whether students recognize that not all datasets have a mode. Many students incorrectly assume Set B's mode might be 7 (the median) or 13 (the maximum), leading to wrong answers. Always verify that a mode actually exists before making comparisons.
Learning Objective Connection: This example addresses identifying when mode is being tested, explaining core strategies (recognizing when no mode exists), and applying mode concepts to GRE-style questions accurately.
Exam Strategy
When approaching GRE mode questions, follow this systematic process:
Step 1: Identify the Question Type
Look for trigger words and phrases: "most frequent," "most common," "appears most often," "typical," or explicitly "mode." Be alert for questions asking you to compare measures of central tendency, as these often include mode.
Step 2: Organize the Data
If given a list of numbers, quickly create a frequency count. Write down each unique value and tally how many times it appears. For small datasets, this takes only seconds and prevents errors. If data is presented in a table or graph, identify the category or value with the highest frequency.
Step 3: Check for Special Cases
Before finalizing your answer, verify:
- Does a mode actually exist, or do all values appear equally?
- Are there multiple modes (bimodal or multimodal)?
- Is the question asking for the mode of grouped data (modal class)?
Step 4: Eliminate Wrong Answers
In multiple-choice questions, eliminate options that:
- Confuse mode with mean (the average)
- Confuse mode with median (the middle value)
- Assume a mode must exist when the data is uniform
- Identify the largest or smallest value as the mode
Time Allocation: Mode questions should typically take 60-90 seconds. If a question involves complex data interpretation or multiple steps, allow up to 2 minutes. Don't spend excessive time on frequency counting—if the dataset is large, look for patterns or use the answer choices to guide your analysis.
Exam Tip: When comparing mode to mean or median in quantitative comparison questions, quickly sketch the data distribution. If the distribution is skewed, the three measures will differ predictably. This can save calculation time.
Process of Elimination Strategy: If you're unsure between two answer choices, ask yourself: "Which answer represents the most frequently occurring value?" This returns you to the fundamental definition and often clarifies confusion.
Memory Techniques
Mnemonic for Mode: "Mode = Most" — The mode is the value that appears MOST frequently. The double "M" creates a strong memory link.
Visualization Strategy: Picture a histogram where the mode is the tallest bar. When you see a dataset, mentally convert it to a bar graph where height represents frequency. The tallest bar is immediately visible as the mode.
Acronym for Distribution Types: "U-B-M-N" (You Be My Number)
- Unimodal: one mode
- Bimodal: two modes
- Multimodal: many modes
- No mode: uniform distribution
Comparison Memory Aid: "Mode Moves Minimally" — Unlike mean, which is heavily affected by outliers, the mode is stable and moves minimally when extreme values are added or removed.
Categorical Data Reminder: Mode is the only measure that works with categories. Think: "Mode works with Make and Model" (categorical data like car types), while mean and median need numbers.
Summary
The mode represents the most frequently occurring value in a dataset and serves as one of three fundamental measures of central tendency tested on the GRE. Unlike mean and median, mode can be applied to categorical data and is unaffected by outliers, making it particularly useful for describing typical values in skewed distributions. Datasets can have one mode (unimodal), multiple modes (bimodal or multimodal), or no mode when all values appear with equal frequency. GRE questions test mode through direct calculation from lists or frequency tables, through comparisons with other measures of central tendency, and through analysis of how dataset changes affect the mode. Success requires recognizing when mode is being tested, accurately counting frequencies, understanding special cases like bimodal distributions or datasets with no mode, and distinguishing mode from mean and median. The mode's simplicity—requiring only frequency counting rather than arithmetic calculation—makes it accessible, but the GRE challenges students with conceptual questions about distribution types and the relationships between different statistical measures.
Key Takeaways
- The mode is the most frequently occurring value in a dataset; find it by counting how many times each value appears
- Datasets can have zero, one, or multiple modes—never assume a mode must exist
- Mode is the only measure of central tendency that works with categorical (non-numerical) data
- Mode is resistant to outliers and extreme values, unlike the mean
- In frequency tables and histograms, the mode corresponds to the category or value with the highest frequency count
- Bimodal distributions (two modes) often indicate two distinct subgroups within the data
- When comparing mode to mean and median, remember that they're equal only in perfectly symmetrical distributions
Related Topics
Mean (Arithmetic Average): Understanding how to calculate and interpret the sum of values divided by the count enables comparison with mode and recognition of when distributions are skewed. Mastering mode provides the foundation for understanding why mean can be misleading in certain datasets.
Median: The middle value when data is ordered connects to mode as another measure of central tendency. Together, these concepts allow complete analysis of data distribution shape and center.
Range and Standard Deviation: These measures of variability complement mode by describing data spread. While mode identifies the most common value, range and standard deviation reveal how dispersed the data is around that center.
Frequency Distributions and Histograms: Visual representations of data frequency directly display mode as the tallest bar or highest point. Mastering mode interpretation prepares students for more complex data visualization questions.
Probability and Expected Value: The mode represents the outcome with highest probability in discrete distributions, connecting descriptive statistics to probability theory tested in advanced GRE questions.
Practice CTA
Now that you've mastered the core concepts of mode, it's time to solidify your understanding through active practice. Attempt the practice questions to test your ability to identify mode in various contexts, distinguish between different distribution types, and apply mode concepts to GRE-style problems. Use the flashcards to reinforce high-yield facts and ensure rapid recall under test conditions. Remember: statistical reasoning is a skill that improves dramatically with deliberate practice. Each problem you solve strengthens your pattern recognition and builds the confidence needed for test day success. You've built a strong conceptual foundation—now transform that knowledge into points on the GRE!
Sign up free to keep reading
Create a free AnvayaPrep account to finish this GRE guide on Mode — plus flashcards and practice questions.