Overview
Data tables are one of the most frequently tested formats in the GRE Quantitative Reasoning section, appearing in approximately 15-20% of all quantitative questions. These questions present numerical information organized in rows and columns, requiring test-takers to extract, compare, calculate, and interpret data efficiently under time pressure. Mastery of GRE data tables is non-negotiable for achieving a competitive score, as these questions assess not only computational skills but also the ability to quickly identify relevant information, recognize patterns, and perform multi-step calculations accurately.
Data table questions on the GRE range from straightforward single-calculation problems to complex multi-step analyses requiring integration of information from multiple rows, columns, or even multiple tables. The format tests fundamental quantitative skills including percentages, ratios, averages, rates of change, and proportional reasoning—all within the context of real-world scenarios such as business metrics, demographic data, scientific measurements, or economic indicators. Unlike pure arithmetic questions, data table problems require an additional layer of information processing: students must first locate and extract the correct values before performing calculations.
Understanding data tables connects directly to broader Data Analysis competencies in the GRE Quantitative Reasoning section. These questions build upon foundational arithmetic and algebra skills while serving as a bridge to more complex data interpretation tasks involving graphs, charts, and statistical reasoning. The ability to work efficiently with tabular data is also essential for tackling Quantitative Comparison questions that incorporate data tables, as well as multi-part problem sets where a single table supports several related questions.
Learning Objectives
- [ ] Identify when Data tables is being tested
- [ ] Explain the core rule or strategy behind Data tables
- [ ] Apply Data tables to GRE-style questions accurately
- [ ] Navigate complex multi-row, multi-column tables to locate specific data points within 15 seconds
- [ ] Perform accurate calculations combining data from multiple table cells, including percentages, ratios, and percent change
- [ ] Recognize common table structures and organizational patterns to accelerate information extraction
- [ ] Evaluate answer choices efficiently by estimating values before performing precise calculations
Prerequisites
- Basic arithmetic operations: Addition, subtraction, multiplication, and division form the computational foundation for all table-based calculations
- Percentage calculations: Converting between fractions, decimals, and percentages is essential since many table questions involve percentage increase/decrease or finding percentages of given values
- Ratio and proportion concepts: Understanding equivalent ratios and proportional relationships enables comparison of values across different table categories
- Average (mean) calculation: Many table questions require computing averages from multiple data points or understanding weighted averages
- Reading comprehension skills: Interpreting column headers, row labels, and table titles accurately prevents misidentification of data values
Why This Topic Matters
Data tables represent how information is organized and communicated in virtually every professional field—from business analytics and financial reporting to scientific research and public policy. The ability to quickly extract insights from tabular data is a fundamental skill for graduate-level academic work, where students regularly encounter research data, experimental results, and statistical summaries presented in table format. Beyond academics, data literacy has become essential in the modern workplace, where decision-making increasingly relies on interpreting dashboards, reports, and data visualizations.
On the GRE specifically, data table questions appear in multiple formats: as standalone problems in the Quantitative Reasoning section, as part of Data Interpretation sets (where 2-3 questions reference the same table), and occasionally within Quantitative Comparison questions. According to ETS data, approximately 3-5 questions per Quantitative section involve interpreting tabular data, making this a high-yield topic that directly impacts your score. These questions typically appear at medium difficulty levels, meaning they're accessible to most test-takers but require careful attention to detail and systematic problem-solving approaches.
Common GRE table scenarios include: sales data by region and time period, demographic statistics by category and year, survey results showing response distributions, financial data comparing multiple companies or products, scientific measurements across different conditions, and performance metrics tracking changes over time. The tables may contain anywhere from 4-5 cells to 30+ cells, with varying levels of complexity in their organization and labeling systems.
Core Concepts
Structure and Organization of Data Tables
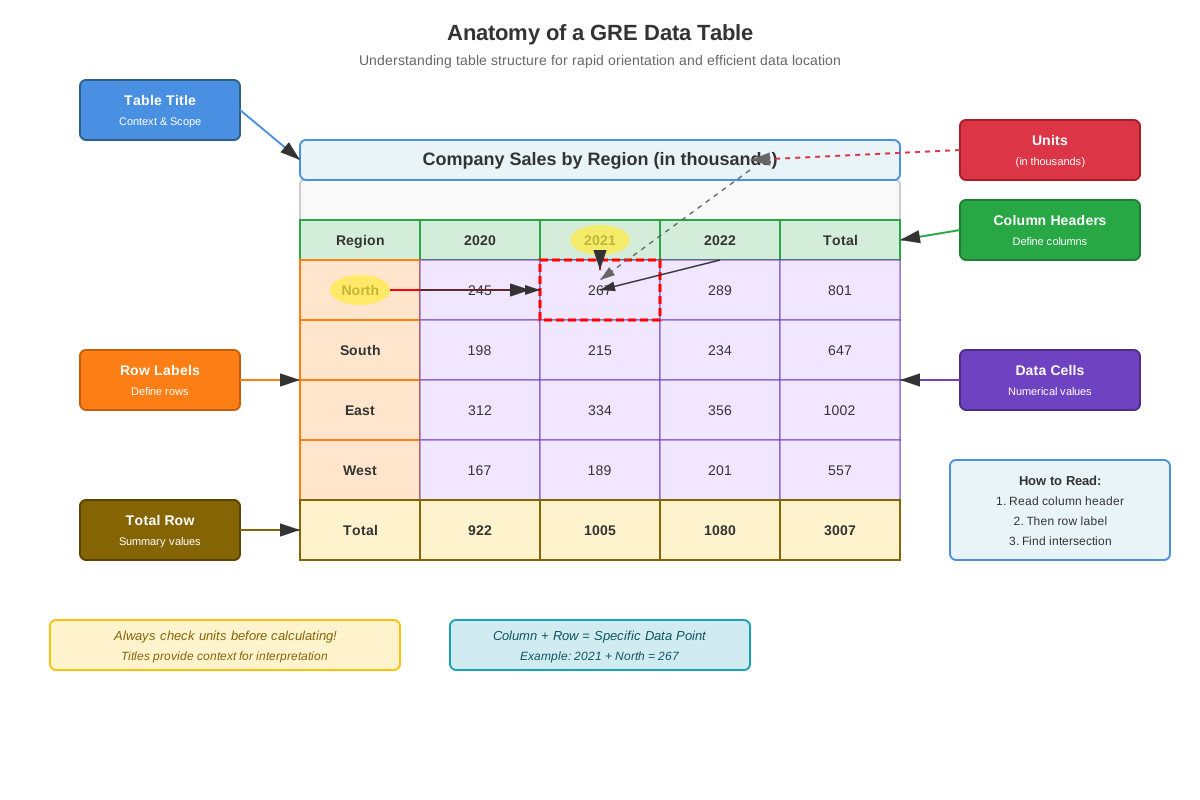
A data table is a systematic arrangement of information in rows and columns, where each cell contains a specific data value. GRE tables typically include several key components: a table title that describes the overall content, column headers that label vertical categories, row labels that identify horizontal categories, and data cells containing numerical values. Some tables also include footnotes or legends that provide crucial context such as units of measurement, data sources, or special notations.
Understanding table organization is critical because GRE questions deliberately test whether students can correctly identify which row and column intersection contains the needed value. Tables may organize data chronologically (years across columns, categories down rows), categorically (different groups or regions), hierarchically (with subtotals and totals), or in matrix format (showing relationships between two sets of categories). The intersection of a specific row and column creates a unique data point that represents a particular combination of those two categories.
Reading and Interpreting Table Elements
Before attempting any calculation, successful test-takers invest 10-15 seconds in understanding the table's structure. This includes reading the title to understand the overall context, scanning column headers to identify what each column represents, reviewing row labels to understand categories, and checking for units (thousands, millions, percentages, etc.) that affect interpretation. Many GRE errors occur because students overlook that values are expressed "in thousands" or misread which year or category a column represents.
Units and scaling deserve particular attention. A table showing "Revenue (in millions of dollars)" means that a cell value of "45" actually represents $45,000,000. Similarly, if a table shows percentages, students must recognize whether they're working with percentage values (which don't require conversion) or whether they need to calculate percentages from raw numbers. Some tables mix different units—for example, showing both counts and percentages in different columns—requiring careful attention to which values are being requested.
Locating Specific Data Points
The fundamental skill in table questions is accurately locating the correct cell. This requires a systematic approach: first identify the relevant row by scanning row labels, then identify the relevant column by reading column headers, and finally trace to the intersection to find the value. For complex tables with many rows and columns, using a finger or pencil to physically trace the row and column (on scratch paper, since you cannot mark the computer screen) helps prevent errors.
Some GRE tables include subtotals, totals, or summary rows/columns that aggregate data from other cells. Questions may specifically ask about these summary values, or they may require students to calculate their own totals from individual cells. Distinguishing between individual category values and aggregate values is essential for answering correctly.
Performing Calculations with Table Data
Once data points are located, GRE questions require various calculations:
Single-value calculations involve extracting one number and performing an operation (e.g., "What is 15% of the value shown for Category A in 2020?"). These are the most straightforward table questions.
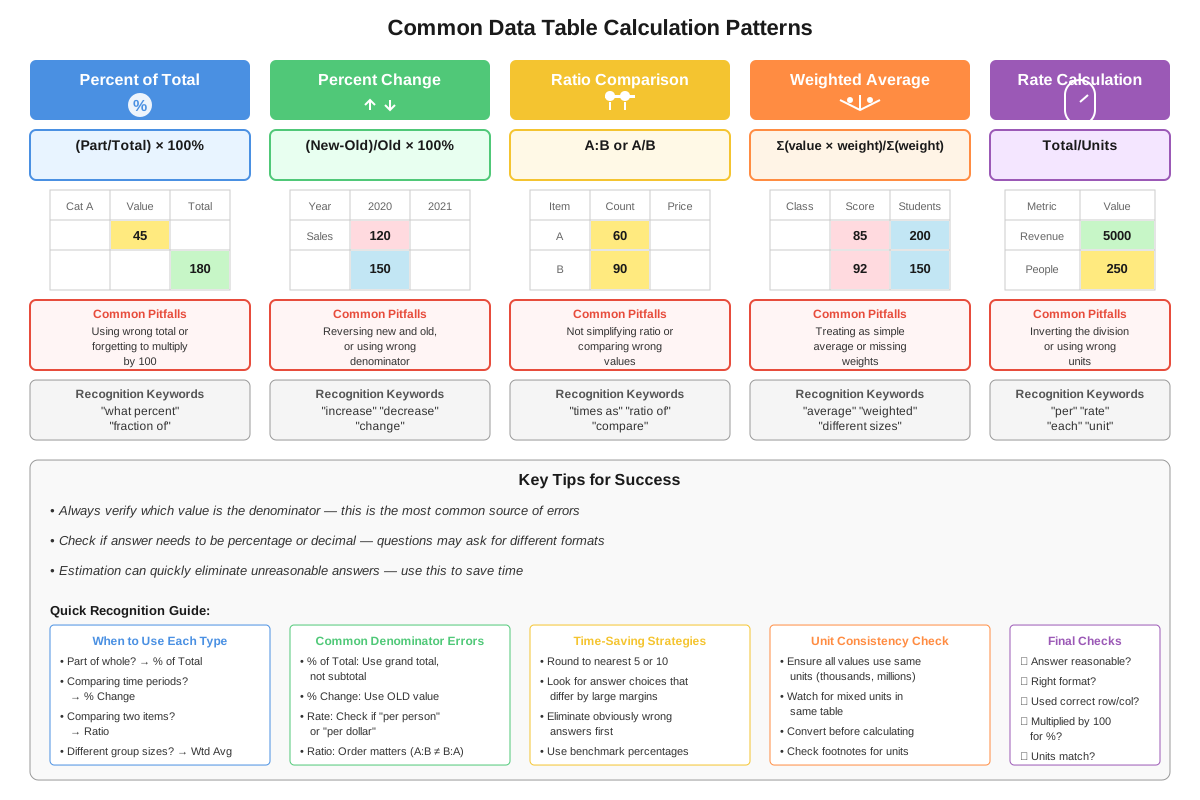
Two-value calculations require combining data from two cells, such as finding the difference between two years, calculating a ratio between two categories, or determining percent change. The percent change formula is particularly high-yield:
Percent Change = ((New Value - Old Value) / Old Value) × 100%Multi-value calculations involve three or more data points, such as finding the average of several categories, summing values across multiple years, or calculating weighted averages. These questions test both computational accuracy and the ability to track multiple values simultaneously.
Comparison operations require evaluating relationships between values: identifying the largest or smallest value in a row or column, determining which category showed the greatest increase, or ranking items by a calculated metric. These questions often appear in Quantitative Comparison format.
Estimation and Approximation Strategies
Given the time pressure on the GRE (approximately 1.75 minutes per question), estimation becomes a powerful strategy for table questions. When answer choices are spread apart (e.g., 15, 25, 35, 45, 55), precise calculation is often unnecessary. Instead, rounding values to friendly numbers enables quick mental math that eliminates incorrect answers.
For example, if calculating 23% of 487, recognize that this is approximately 25% (one-quarter) of 500, which equals 125. This estimation immediately eliminates answer choices like 75 or 200. Estimation is particularly valuable for multi-step calculations where small rounding errors in intermediate steps still lead to the correct answer choice.
Common Table Question Types
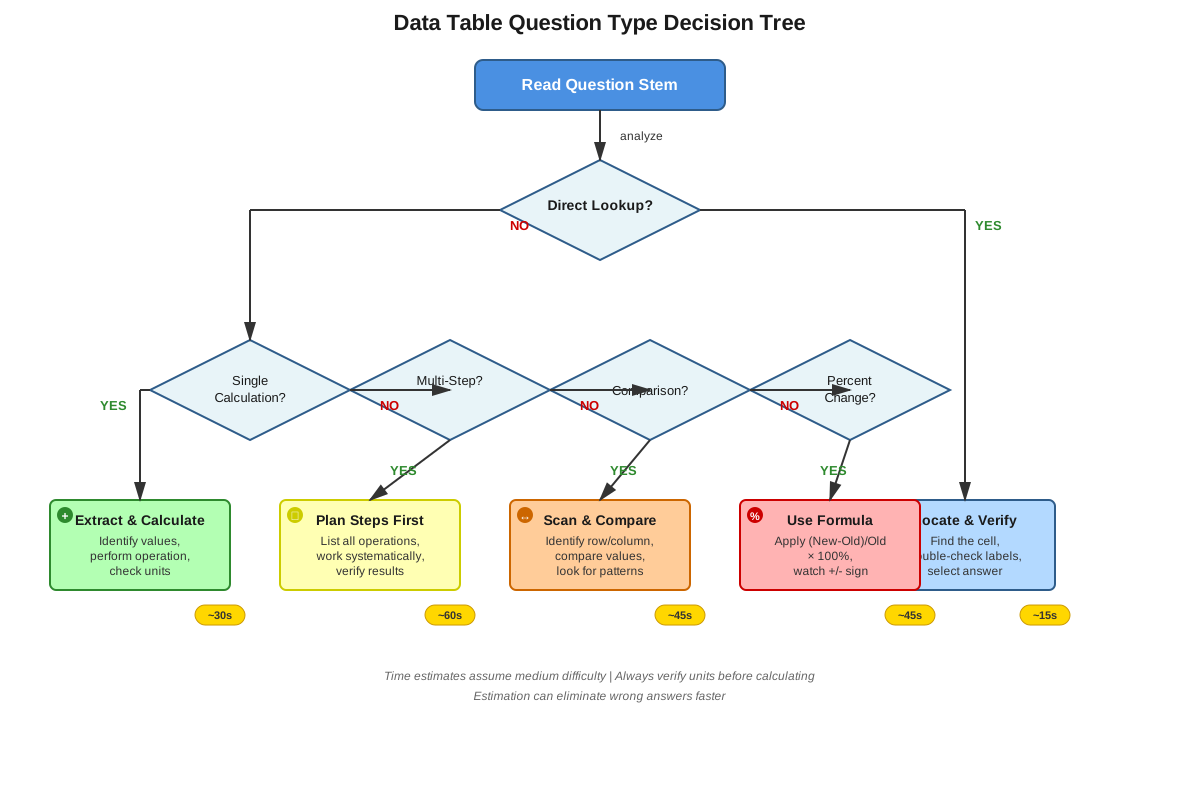
Direct lookup questions simply ask for a value that appears in the table: "What was the revenue for Product X in 2019?" These test careful reading more than calculation.
Calculation questions require one or more operations using table values: "How much greater was the 2020 value than the 2018 value?" or "What was the average of the three values shown?"
Percentage questions are extremely common and include: finding what percent one value is of another, calculating percent increase or decrease, or determining a percentage of a given value.
Ratio and proportion questions ask students to compare values: "What is the ratio of Category A to Category B?" or "If the ratio remains constant, what would the value be in 2025?"
Ranking and comparison questions require evaluating multiple values: "Which category showed the greatest percent increase?" or "In how many years did the value exceed 500?"
Multi-Table and Integrated Questions
Some GRE questions present two related tables and require integrating information from both. For example, one table might show quantities while another shows prices, and the question asks for total revenue. These questions test the ability to understand relationships between datasets and perform calculations that span multiple sources. The key strategy is to clearly identify what information comes from which table and to organize the solution step-by-step.
Concept Relationships
The concepts within data table questions form a hierarchical relationship: Table Structure Understanding → Data Point Location → Value Extraction → Calculation Performance → Answer Verification. Each step depends on the previous one; attempting calculations before correctly identifying values leads to errors regardless of computational skill.
Data table skills connect directly to prerequisite knowledge of percentages (used in percent change and percentage-of-total calculations), ratios (used in comparing values across categories), and averages (used in finding typical values or central tendencies). These foundational concepts are applied within the context of the table structure.
Looking forward, mastery of data tables enables progression to more complex Data Interpretation topics including bar graphs, line graphs, pie charts, and scatter plots—all of which present similar information in visual rather than tabular format. The analytical skills developed through table questions (identifying relevant data, performing accurate calculations, making comparisons) transfer directly to these graphical representations. Additionally, table interpretation skills support word problem solving, where information must be extracted from text rather than organized rows and columns.
The relationship between data tables and Quantitative Comparison questions is particularly important: many QC questions present a table and ask students to compare two calculated values (Quantity A vs. Quantity B). This format combines table interpretation skills with the unique strategic considerations of QC questions (when to calculate exactly vs. when to estimate or compare conceptually).
Quick check — test yourself on Data tables so far.
Try Flashcards →High-Yield Facts
⭐ Data table questions appear in approximately 15-20% of GRE Quantitative Reasoning questions, making them one of the highest-yield topics to master
⭐ Always check the units and scaling indicated in the table title or column headers—values expressed "in thousands" or "in millions" are a common source of errors
⭐ Percent change = ((New - Old) / Old) × 100% is the most frequently tested formula in table questions
⭐ When answer choices are spread apart, estimation through rounding can save 30-45 seconds per question
⭐ The intersection of a row and column creates a unique data point—use systematic tracing to avoid reading the wrong cell
- Tables may include subtotals, totals, or summary rows that aggregate other values—distinguish these from individual data points
- Multi-part Data Interpretation sets present 2-3 questions based on the same table, making efficient initial table analysis especially valuable
- Percentage questions appear more frequently than any other calculation type in table problems
- Some tables present data in non-chronological order or use unconventional organization—always read labels carefully rather than making assumptions
- When a question asks for "approximately" a value, the test-makers expect estimation rather than precise calculation
- Footnotes and legends may contain critical information about data collection methods, special cases, or notation systems
- Questions asking "which category" or "in how many years" require comparing multiple values rather than calculating a single answer
- Tables with many rows and columns are designed to test information location skills as much as calculation skills
Common Misconceptions
Misconception: All values in a table can be used directly in calculations without considering units.
Correction: Always check whether values are expressed in thousands, millions, percentages, or other units. A value of "50" in a table titled "Revenue (in millions)" represents 50,000,000, not 50. Failing to account for scaling is one of the most common errors in table questions.
Misconception: The largest number in a table always represents the greatest percent increase.
Correction: Percent increase depends on the starting value, not the absolute change. A change from 10 to 20 is a 100% increase, while a change from 100 to 105 is only a 5% increase, even though the absolute change (5) is smaller than the first scenario's change (10).
Misconception: When calculating an average from a table, all values should be included.
Correction: Read the question carefully to determine which specific values should be included in the average. Questions often ask for "the average of the three products shown" or "the average for years 2015-2018," requiring selective inclusion of only relevant values.
Misconception: Percent change and percentage point change are the same thing.
Correction: These are distinct concepts. If a value increases from 20% to 25%, the percentage point change is 5 points, but the percent change is (5/20) × 100% = 25%. GRE questions may test understanding of this difference.
Misconception: The fastest approach is to start calculating immediately upon reading the question.
Correction: Investing 10-15 seconds to understand the table structure, identify relevant rows and columns, and plan the calculation approach prevents errors and often saves time overall. Rushing into calculations without clear understanding of what values are needed leads to using incorrect data points.
Misconception: All answer choices require precise calculation to distinguish between them.
Correction: When answer choices differ significantly (e.g., 150, 300, 450, 600), estimation through rounding provides the correct answer much faster than precise calculation. The GRE rewards efficient problem-solving, not unnecessary precision.
Worked Examples
Example 1: Multi-Step Percentage Calculation
Table: Annual Sales by Region (in thousands of dollars)
| Region | 2018 | 2019 | 2020 |
|---|---|---|---|
| North | 450 | 520 | 585 |
| South | 380 | 410 | 445 |
| East | 520 | 490 | 510 |
| West | 410 | 455 | 500 |
Question: What was the percent increase in North region sales from 2018 to 2020?
Solution:
Step 1: Identify the relevant values. We need North region sales for 2018 and 2020.
- 2018 North sales: 450 (thousands)
- 2020 North sales: 585 (thousands)
Step 2: Apply the percent change formula.
Percent Change = ((New Value - Old Value) / Old Value) × 100%
Percent Change = ((585 - 450) / 450) × 100%
Step 3: Calculate the difference.
- 585 - 450 = 135
Step 4: Calculate the ratio.
- 135 / 450 = 0.30
Step 5: Convert to percentage.
- 0.30 × 100% = 30%
Answer: The North region experienced a 30% increase in sales from 2018 to 2020.
Connection to Learning Objectives: This example demonstrates applying data tables to GRE-style questions by locating specific values, performing multi-step calculations, and using the core percent change strategy.
Example 2: Comparison Across Multiple Categories
Table: Student Enrollment by Department
| Department | Undergraduate | Graduate | Total |
|---|---|---|---|
| Engineering | 1,240 | 380 | 1,620 |
| Sciences | 980 | 420 | 1,400 |
| Humanities | 1,450 | 290 | 1,740 |
| Business | 1,100 | 510 | 1,610 |
Question: Which department has the highest ratio of graduate students to undergraduate students?
Solution:
Step 1: Recognize that this question requires calculating a ratio for each department and comparing them. Rather than calculating all four ratios precisely, we can estimate to save time.
Step 2: Calculate or estimate each ratio (Graduate/Undergraduate):
Engineering: 380/1,240 ≈ 380/1,200 ≈ 0.32 (approximately 1:3)
Sciences: 420/980 ≈ 420/1,000 ≈ 0.42 (approximately 2:5)
Humanities: 290/1,450 ≈ 290/1,500 ≈ 0.19 (approximately 1:5)
Business: 510/1,100 ≈ 510/1,000 ≈ 0.51 (approximately 1:2)
Step 3: Compare the ratios. Business has the highest ratio at approximately 0.51, meaning graduate students represent about half the undergraduate population—a higher proportion than any other department.
Answer: Business has the highest ratio of graduate to undergraduate students.
Connection to Learning Objectives: This example illustrates the core strategy of using estimation when comparing multiple values, demonstrating efficient application of data table skills under time pressure. It also shows how to identify when precise calculation is unnecessary.
Exam Strategy
When approaching GRE data table questions, implement a systematic four-phase strategy: Orient, Locate, Calculate, Verify.
Orient Phase (10-15 seconds): Before reading the question, scan the table structure. Read the title to understand the context, note the column headers and row labels, check for units or scaling (thousands, millions, percentages), and identify whether there are subtotals or summary rows. This investment prevents errors and speeds up the actual problem-solving.
Locate Phase: After reading the question, identify exactly which cells contain the needed values. For complex tables, use your scratch paper to note the specific row and column intersections. If the question requires multiple values, list them all before beginning calculations to ensure nothing is missed.
Calculate Phase: Perform the required operations, using estimation when answer choices permit. For multi-step problems, write intermediate results on scratch paper to avoid mental math errors. When calculating percentages, ratios, or averages, double-check that you're using the correct formula and the correct values.
Verify Phase: Before selecting an answer, perform a reasonableness check. Does the magnitude make sense? If calculating a percent increase, is the answer positive (for an increase) or negative (for a decrease)? If finding an average, does it fall between the minimum and maximum values? This quick verification catches many careless errors.
Trigger words and phrases that signal specific approaches:
- "Approximately" or "closest to" → Use estimation and rounding
- "Percent increase/decrease" → Apply percent change formula
- "How many" or "which category" → Requires comparing multiple values
- "Average" or "mean" → Sum relevant values and divide by count
- "Ratio of X to Y" → Calculate X/Y
- "Total" or "combined" → Sum multiple values
- "Difference between" → Subtract values
Process-of-elimination tips: When answer choices are numerical, eliminate options that are clearly too large or too small based on quick estimation. For questions asking "which category," eliminate any categories that obviously don't meet the criteria before calculating precisely. If a question asks for a percentage and one answer choice is greater than 100% when the context suggests a part-of-whole relationship, eliminate it immediately.
Time allocation: Allocate 1.5-2 minutes for standard table questions. If a question is part of a Data Interpretation set (multiple questions about the same table), spend slightly more time (20-30 seconds) understanding the table initially, as this investment pays off across multiple questions. If you find yourself spending more than 2.5 minutes on a single table question, make your best educated guess and move on—the opportunity cost of excessive time on one question is too high.
Memory Techniques
PERCENT mnemonic for percent change calculations:
- Pick the old (starting) value
- Establish the new (ending) value
- Remove old from new (subtract)
- Calculate the difference
- Evaluate by dividing by old
- Note as percentage (multiply by 100)
- Test reasonableness
TABLE acronym for systematic table analysis:
- Title: Read to understand overall context
- Axes: Identify what rows and columns represent
- Base: Check the units and scaling
- Locate: Find specific values needed
- Evaluate: Perform calculations and verify
Visualization strategy: When first viewing a table, mentally highlight or visualize the relevant row and column as intersecting lines that meet at your target cell. This spatial visualization reduces the chance of reading from the wrong row or column.
The "Finger Trace" technique: On your scratch paper, draw a simple grid representing the table structure and physically trace with your pencil to the intersection point. This kinesthetic approach helps prevent the common error of reading from adjacent cells.
Unit conversion reminder: Create a mental image of a table with a giant magnifying glass over the title/header area, reminding you to always check units before calculating. Visualize the phrase "thousands" or "millions" in bright red to make it memorable.
Summary
Data tables are a high-yield GRE Quantitative Reasoning topic that tests the ability to extract, interpret, and calculate with numerical information organized in rows and columns. Success requires a systematic approach: understanding table structure and organization, accurately locating specific data points at row-column intersections, performing calculations using appropriate formulas (especially percent change), and verifying answers for reasonableness. The most common question types involve percentage calculations, comparisons across categories, and multi-step operations combining values from multiple cells. Critical skills include checking units and scaling, distinguishing between individual values and summary totals, and using estimation strategically when answer choices permit. Common errors stem from misreading units, using values from incorrect cells, confusing percent change with absolute change, and rushing into calculations without fully understanding the table structure. By investing 10-15 seconds in initial table orientation and applying systematic location and calculation strategies, test-takers can achieve both accuracy and efficiency on these frequently-tested questions.
Key Takeaways
- Data table questions appear in 15-20% of GRE Quantitative Reasoning questions, making them essential for score optimization
- Always check units and scaling in table titles and headers—values "in thousands" or "in millions" require adjustment before interpretation
- The percent change formula ((New - Old) / Old × 100%) is the single most tested calculation in table questions
- Systematic table analysis (Orient → Locate → Calculate → Verify) prevents the most common errors and improves time efficiency
- Estimation through rounding is a powerful strategy when answer choices are spread apart, often saving 30-45 seconds per question
- The intersection of a specific row and column creates a unique data point—use physical or mental tracing to avoid reading from wrong cells
- Multi-step questions require careful organization: identify all needed values before beginning calculations and write intermediate results on scratch paper
Related Topics
Bar Graphs and Column Charts: Visual representations of data that often present the same information as tables but in graphical format. Mastering data tables provides the analytical foundation for interpreting these visual displays, as the underlying skills (comparing values, calculating changes, identifying trends) remain the same.
Line Graphs: Show trends over time and require similar skills in reading axes, extracting values, and calculating rates of change. Table interpretation skills transfer directly to understanding the numerical relationships represented visually in line graphs.
Pie Charts and Circle Graphs: Present part-to-whole relationships and percentage distributions. The percentage calculation skills developed through table questions apply directly to interpreting and calculating with pie chart data.
Statistical Measures: Topics including mean, median, mode, range, and standard deviation often use data from tables as their source. Strong table skills enable efficient extraction of the values needed for statistical calculations.
Word Problems with Data: Many GRE word problems embed numerical data within text rather than organizing it in tables. The analytical skills of identifying relevant information and performing multi-step calculations transfer between these formats.
Practice CTA
Now that you've mastered the core concepts and strategies for GRE data table questions, it's time to apply this knowledge through deliberate practice. Work through the practice questions associated with this topic, focusing on implementing the systematic Orient-Locate-Calculate-Verify approach. Use the flashcards to reinforce key formulas, especially the percent change calculation, and to internalize common question patterns. Remember that data table questions reward both accuracy and efficiency—as you practice, track not only whether you're getting questions correct but also whether you're completing them within the target time of 1.5-2 minutes. Each practice question is an opportunity to refine your approach and build the confidence that leads to peak performance on test day. Your investment in mastering this high-yield topic will directly translate to points on your GRE score.
Sign up free to keep reading
Create a free AnvayaPrep account to finish this GRE guide on Data tables — plus flashcards and practice questions.