Overview
Venn diagrams are powerful visual tools used to represent relationships between sets and their elements. On the GRE Quantitative Reasoning section, these diagrams appear frequently in Data Analysis questions, testing a student's ability to organize information, identify overlapping categories, and perform calculations involving unions, intersections, and complements of sets. Mastering GRE Venn diagrams is essential because they provide an efficient method for solving complex word problems that involve multiple overlapping groups—whether the question concerns survey respondents with different preferences, students enrolled in various courses, or employees with different skill sets.
The beauty of Venn diagrams lies in their ability to transform abstract set theory into concrete visual representations. Rather than wrestling with confusing verbal descriptions of overlapping categories, students can draw circles that intersect, label regions systematically, and use algebraic reasoning to find unknown values. This visual-spatial approach reduces cognitive load and minimizes calculation errors, making it one of the most reliable problem-solving strategies for certain question types on the GRE.
Within the broader context of Quantitative Reasoning, Venn diagrams connect directly to fundamental concepts in probability, statistics, and logical reasoning. They serve as a bridge between pure arithmetic and data interpretation, requiring students to synthesize information from word problems, translate it into mathematical relationships, and perform multi-step calculations. Questions involving Venn diagrams often appear alongside tables, charts, and data interpretation sets, making them a cornerstone skill for achieving a competitive score in the Data Analysis domain.
Learning Objectives
- [ ] Identify when Venn diagrams is being tested
- [ ] Explain the core rule or strategy behind Venn diagrams
- [ ] Apply Venn diagrams to GRE-style questions accurately
- [ ] Construct accurate Venn diagrams from verbal descriptions involving two or three sets
- [ ] Calculate values for all regions of a Venn diagram using algebraic equations
- [ ] Solve problems involving the inclusion-exclusion principle for overlapping sets
- [ ] Recognize and avoid common calculation errors in multi-set problems
Prerequisites
- Basic set notation and terminology: Understanding terms like "union," "intersection," "element," and "subset" is fundamental to interpreting Venn diagram problems correctly
- Algebraic equation solving: Most Venn diagram problems require setting up and solving linear equations with one or more variables
- Word problem translation skills: Students must convert verbal descriptions into mathematical relationships before drawing diagrams
- Basic arithmetic operations: Addition, subtraction, and working with whole numbers and percentages are essential for calculations within diagram regions
Why This Topic Matters
Venn diagrams appear in approximately 10-15% of GRE Quantitative Reasoning questions, making them a high-yield topic that directly impacts test scores. These questions typically appear in the Data Analysis category and are considered medium-difficulty problems that separate average scorers from high performers. Students who master Venn diagram techniques can solve these problems quickly and accurately, gaining a significant time advantage that allows for more careful work on harder questions.
In real-world applications, Venn diagrams are ubiquitous in business analytics, market research, epidemiology, and database management. Companies use them to analyze customer segments with overlapping characteristics, researchers employ them to visualize study populations with multiple attributes, and data scientists rely on them to understand relationships in complex datasets. This practical relevance makes Venn diagram skills valuable beyond test preparation.
On the GRE, Venn diagram questions commonly appear as word problems describing surveys, course enrollments, product preferences, or demographic data. The test may present information about groups with overlapping membership and ask students to determine the size of specific regions, calculate percentages, or identify relationships between sets. Questions may involve two-circle diagrams (simpler) or three-circle diagrams (more complex), and they often include "neither" categories that require careful attention to the universal set.
Core Concepts
Understanding Set Relationships
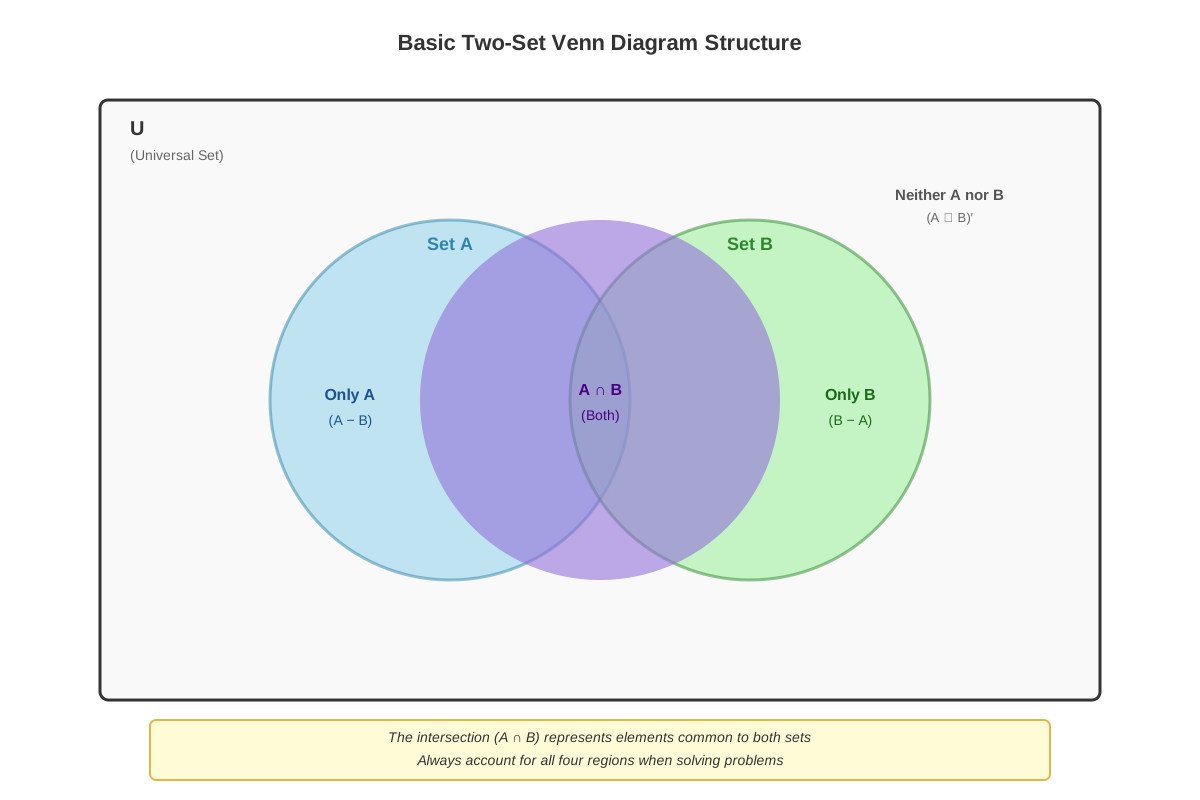
A Venn diagram consists of overlapping circles (or other closed curves) that represent sets, with each region corresponding to a specific combination of set memberships. The universal set (often denoted U) contains all elements under consideration and is typically represented by a rectangle enclosing all circles. Each circle represents a distinct set, and the overlapping regions show elements that belong to multiple sets simultaneously.
For two sets A and B, a Venn diagram creates four distinct regions:
- Elements in A only (A but not B)
- Elements in B only (B but not A)
- Elements in both A and B (the intersection, denoted A ∩ B)
- Elements in neither A nor B (outside both circles but within the universal set)
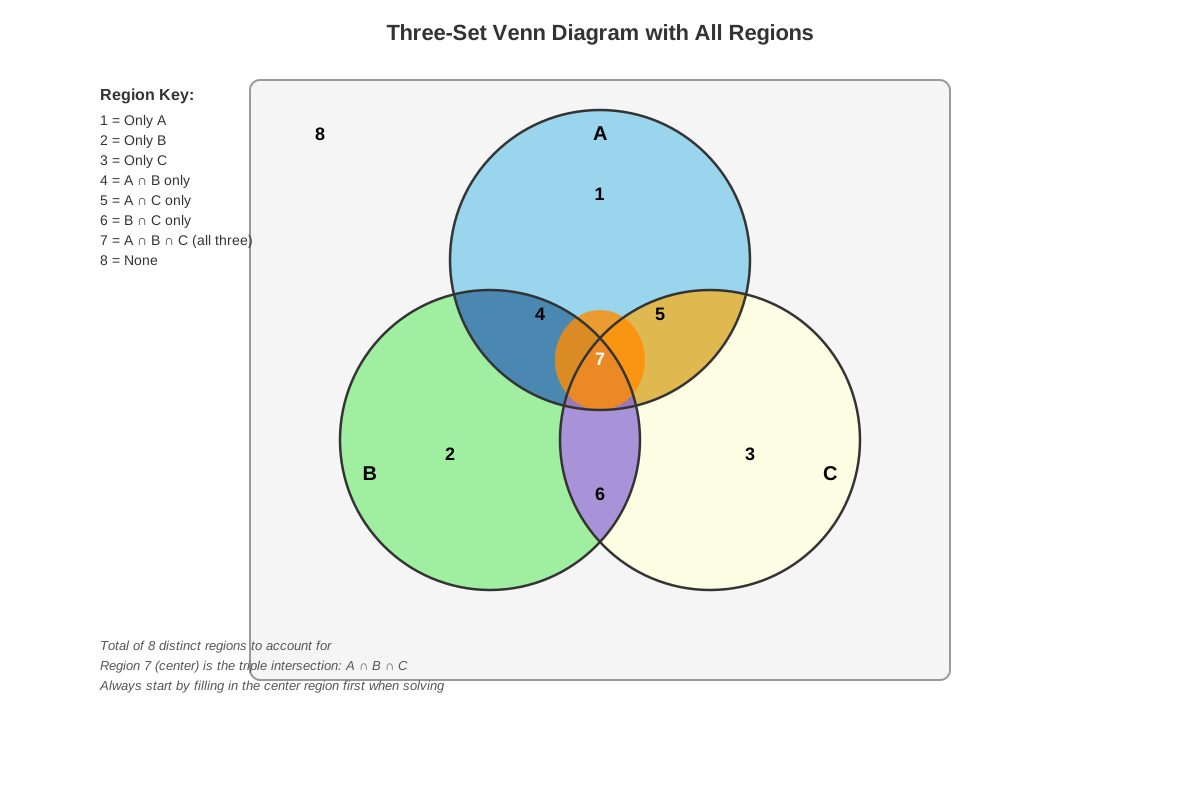
For three sets A, B, and C, the diagram becomes more complex with eight distinct regions:
- A only
- B only
- C only
- A and B only (not C)
- A and C only (not B)
- B and C only (not A)
- All three sets (A ∩ B ∩ C)
- None of the sets
The Inclusion-Exclusion Principle
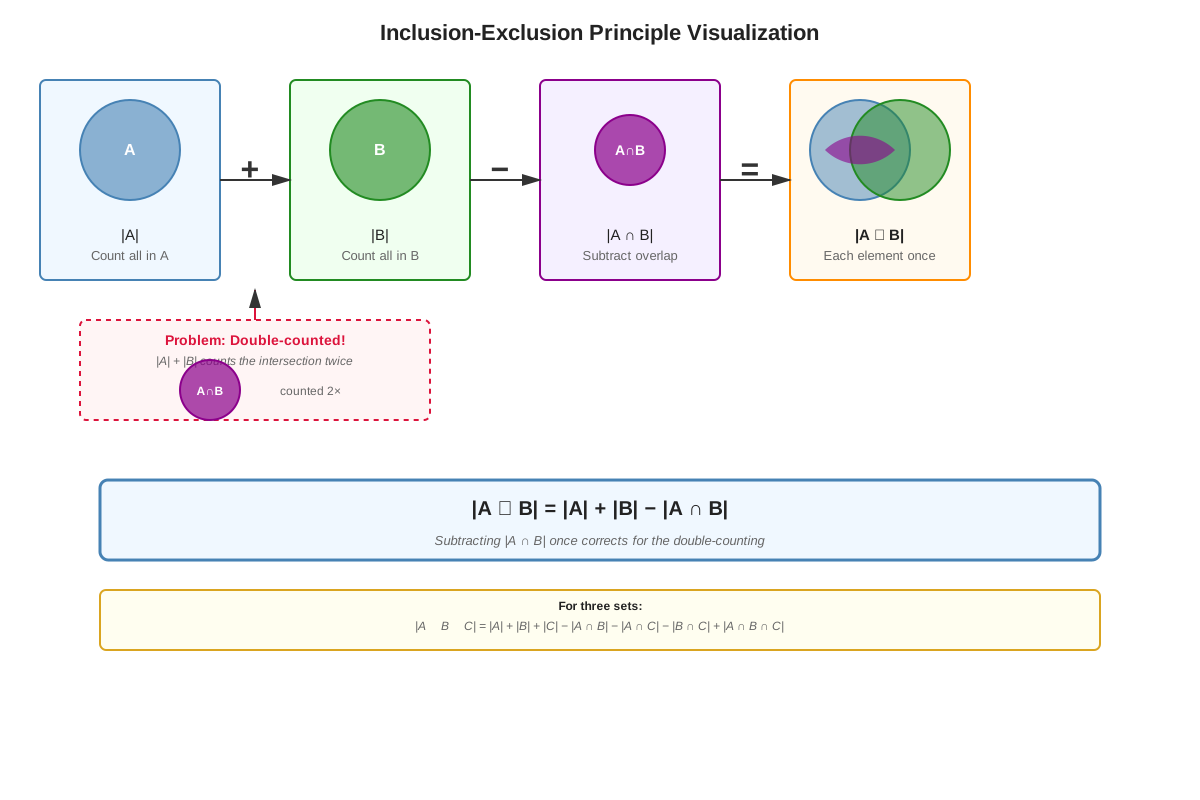
The inclusion-exclusion principle is the mathematical foundation underlying Venn diagram calculations. For two sets, this principle states:
|A ∪ B| = |A| + |B| - |A ∩ B|This formula accounts for the fact that when counting the total number of elements in either set A or set B (the union, denoted A ∪ B), simply adding |A| and |B| counts the intersection twice. Therefore, we must subtract |A ∩ B| once to get the correct total.
For three sets, the principle extends to:
|A ∪ B ∪ C| = |A| + |B| + |C| - |A ∩ B| - |A ∩ C| - |B ∩ C| + |A ∩ B ∩ C|This formula adds all three sets, subtracts the pairwise intersections (which were double-counted), then adds back the three-way intersection (which was subtracted too many times).
Systematic Region Labeling Strategy
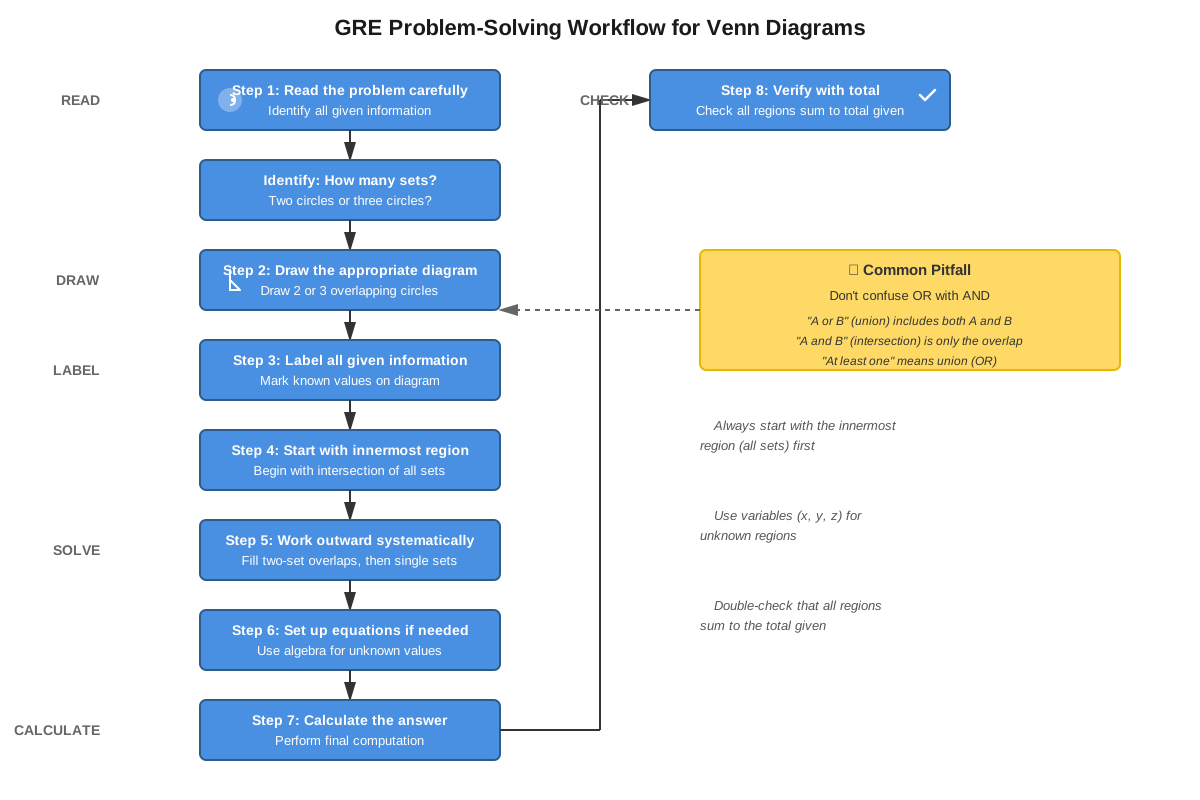
The most reliable approach to solving GRE Venn diagram problems involves working from the innermost region outward:
- Start with the center: For three-set problems, begin by labeling the region where all three sets overlap (A ∩ B ∩ C)
- Move to pairwise intersections: Label regions where exactly two sets overlap, subtracting the center value if necessary
- Calculate single-set regions: Determine the "only" regions by subtracting all overlapping portions from the total set size
- Find the "neither" region: Subtract the sum of all other regions from the universal set total
This systematic approach prevents the most common error in Venn diagram problems: confusing "total in a set" with "only in that set."
Translating Word Problems into Diagrams
GRE questions rarely present information in the ideal order for diagram construction. Students must identify key phrases and translate them correctly:
| Phrase in Problem | Mathematical Meaning | Diagram Location |
|---|---|---|
| "both A and B" | A ∩ B | Overlapping region |
| "A or B" | A ∪ B | All of both circles |
| "only A" | A but not B | Non-overlapping part of A |
| "at least one of A or B" | A ∪ B | All of both circles |
| "neither A nor B" | (A ∪ B)' | Outside both circles |
| "exactly one of A or B" | (A ∪ B) - (A ∩ B) | Non-overlapping parts only |
| "all three" | A ∩ B ∩ C | Center region (3 sets) |
Algebraic Setup and Solving
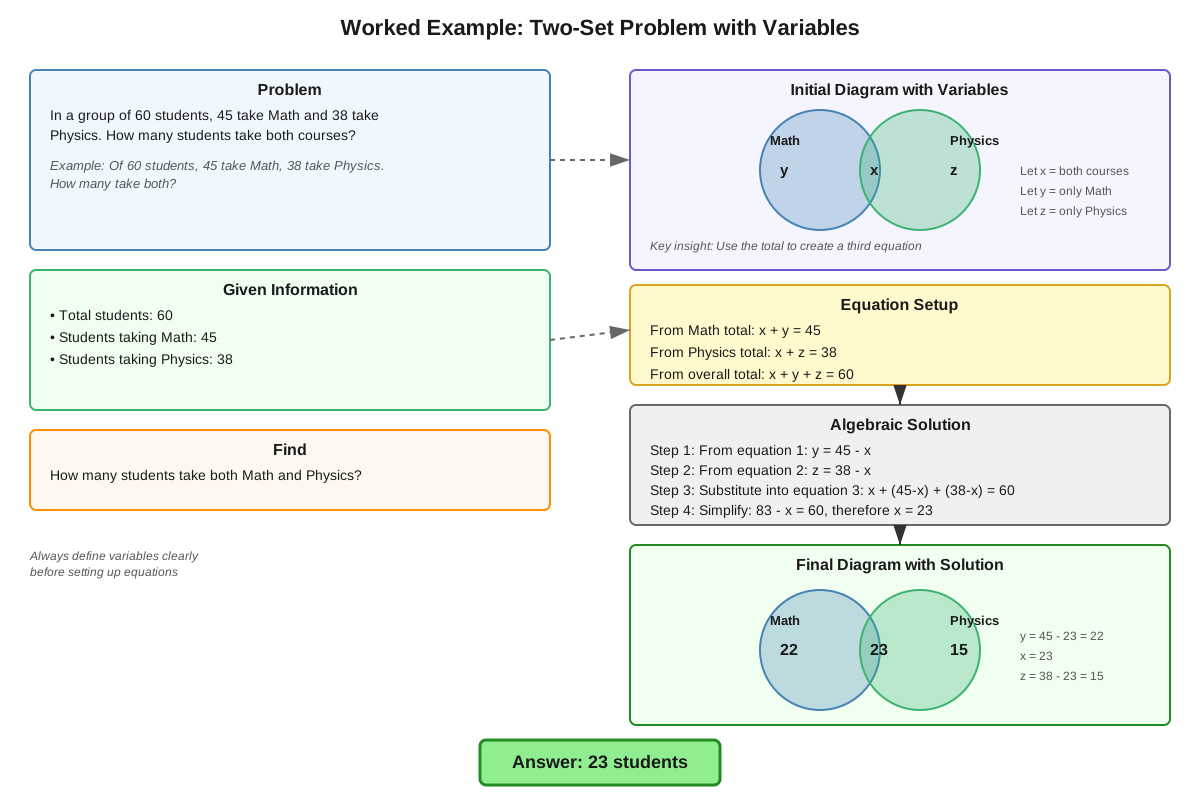
Most GRE Venn diagram problems provide some information and ask for unknown values. The solution process involves:
- Draw the diagram: Sketch circles with appropriate overlaps
- Assign variables: Use x, y, z for unknown regions or work with given numbers
- Write equations: Based on the total for each set and the universal set
- Solve systematically: Use substitution or elimination to find all values
- Verify: Check that all regions sum to the universal set total
For example, if told "50 people total, 30 like coffee, 25 like tea, 10 like both," students should:
- Place 10 in the intersection
- Calculate coffee only: 30 - 10 = 20
- Calculate tea only: 25 - 10 = 15
- Calculate neither: 50 - (20 + 10 + 15) = 5
Concept Relationships
The core concepts in Venn diagram problems form a hierarchical structure. Understanding set relationships provides the foundation for drawing accurate diagrams. This understanding directly enables application of the inclusion-exclusion principle, which governs all calculations involving overlapping sets. The principle, in turn, informs the systematic region labeling strategy, which provides a step-by-step method for organizing information.
The translation skill (converting word problems into diagrams) acts as the entry point to the entire problem-solving process. Without accurate translation, even perfect computational skills will yield wrong answers. Once translation is complete, the algebraic setup phase connects Venn diagrams to broader GRE algebra skills, demonstrating that these problems are fundamentally equation-solving exercises with a visual component.
These concepts also connect to prerequisite knowledge: set notation provides the vocabulary, algebra provides the computational tools, and word problem skills provide the interpretation framework. Looking forward, mastery of Venn diagrams enhances performance on probability questions (which often involve overlapping events), data interpretation questions (which may present set information in tables), and logical reasoning questions (which test understanding of categorical relationships).
The relationship map flows as follows: Word Problem → Translation → Diagram Structure → Region Labeling → Equation Setup → Algebraic Solution → Verification
High-Yield Facts
⭐ The intersection must be subtracted when using the inclusion-exclusion principle because it gets counted twice when adding individual set totals
⭐ In a two-set Venn diagram, there are always exactly four distinct regions to consider: A only, B only, both, and neither
⭐ The "neither" category is calculated by subtracting all other regions from the universal set total
⭐ When a problem states "X people have characteristic A," this typically means the total in set A, including overlaps, not "only A"
⭐ For three-set problems, always start by filling in the center region (all three sets) first, then work outward
- The sum of all regions in a Venn diagram must equal the total of the universal set
- "At least one" means the union of sets (everything in any of the circles)
- "Exactly one" means the sum of non-overlapping regions only, excluding all intersections
- Three-set Venn diagrams have eight distinct regions, and problems often test whether students can identify all of them
- Percentages in Venn diagram problems must be converted to actual numbers before performing calculations, or all values must be kept as percentages consistently
- The complement of a set A (denoted A') includes everything in the universal set except A
- When sets are described as "mutually exclusive" or "disjoint," their intersection is zero (no overlap)
Quick check — test yourself on Venn diagrams so far.
Try Flashcards →Common Misconceptions
Misconception: When told "30 people like coffee," students place 30 in the "coffee only" region → Correction: The number 30 represents the total in the coffee circle, including any overlaps with other sets. The "coffee only" region is calculated by subtracting all overlapping portions from 30.
Misconception: The inclusion-exclusion formula for two sets is |A ∪ B| = |A| + |B| + |A ∩ B| → Correction: The intersection must be subtracted, not added: |A ∪ B| = |A| + |B| - |A ∩ B|. Adding the intersection would count those elements three times total instead of once.
Misconception: In a three-set problem, "A and B" means the region where only A and B overlap, excluding C → Correction: "A and B" means A ∩ B, which includes all regions where both A and B are present, including the center region where all three sets overlap. To specify "A and B but not C," the problem must explicitly exclude C.
Misconception: The "neither" category can be ignored if the problem doesn't mention it → Correction: The "neither" region is essential for ensuring all regions sum to the universal set total. Even if not directly asked about, it often must be calculated to verify the solution or to find other values.
Misconception: Percentages and raw numbers can be mixed freely in Venn diagram calculations → Correction: All values must be in the same units. If some information is given as percentages and some as raw numbers, convert everything to one format before performing calculations, or errors will result.
Misconception: Drawing circles that don't overlap means the sets have no relationship → Correction: Non-overlapping circles represent mutually exclusive sets (disjoint sets with no common elements). This is a specific relationship, not the absence of one. Most GRE problems involve overlapping sets.
Worked Examples
Example 1: Two-Set Survey Problem
Problem: In a survey of 100 students, 60 students study French, 45 study Spanish, and 25 study both languages. How many students study neither French nor Spanish?
Solution:
Step 1: Identify the sets and universal set
- Universal set U = 100 students
- Set F (French) = 60 students total
- Set S (Spanish) = 45 students total
- F ∩ S (both) = 25 students
Step 2: Draw a two-circle Venn diagram with circles F and S overlapping
Step 3: Label regions systematically, starting with the intersection
- Both languages (F ∩ S): 25
Step 4: Calculate "only" regions
- French only: 60 - 25 = 35
- Spanish only: 45 - 25 = 20
Step 5: Calculate "neither"
- Total in at least one language: 35 + 25 + 20 = 80
- Neither: 100 - 80 = 20
Alternative approach using inclusion-exclusion:
- |F ∪ S| = |F| + |S| - |F ∩ S|
- |F ∪ S| = 60 + 45 - 25 = 80
- Neither = 100 - 80 = 20
Answer: 20 students study neither language
This problem directly addresses the learning objective of applying Venn diagrams to GRE-style questions and demonstrates the systematic labeling strategy.
Example 2: Three-Set Problem with Algebra
Problem: At a company, 200 employees were surveyed about their skills. 120 know Python, 100 know SQL, 80 know Excel. 50 know both Python and SQL, 40 know both Python and Excel, 30 know both SQL and Excel. If 20 employees know all three skills, how many employees know none of these three skills?
Solution:
Step 1: Identify all given information
- Universal set: 200 employees
- P (Python) = 120, S (SQL) = 100, E (Excel) = 80
- P ∩ S = 50, P ∩ E = 40, S ∩ E = 30
- P ∩ S ∩ E = 20
Step 2: Draw a three-circle Venn diagram
Step 3: Start with the center (all three)
- All three skills: 20
Step 4: Calculate pairwise "only" intersections (two sets but not the third)
- Python and SQL only (not Excel): 50 - 20 = 30
- Python and Excel only (not SQL): 40 - 20 = 20
- SQL and Excel only (not Python): 30 - 20 = 10
Step 5: Calculate single-set "only" regions
- Python only: 120 - (30 + 20 + 20) = 120 - 70 = 50
- SQL only: 100 - (30 + 20 + 10) = 100 - 60 = 40
- Excel only: 80 - (20 + 20 + 10) = 80 - 50 = 30
Step 6: Sum all regions and find "none"
- Total with at least one skill: 50 + 40 + 30 + 30 + 20 + 10 + 20 = 200
- Wait—this equals the universal set, so none = 0
Alternative verification using inclusion-exclusion:
- |P ∪ S ∪ E| = 120 + 100 + 80 - 50 - 40 - 30 + 20 = 200
- None = 200 - 200 = 0
Answer: 0 employees know none of the three skills (all 200 employees know at least one skill)
This example demonstrates the complete systematic approach for three-set problems and shows how to verify answers using the inclusion-exclusion principle.
Exam Strategy
When approaching GRE Venn diagram questions, first scan for trigger phrases that indicate this problem type: "both," "either," "neither," "only," "at least one," "survey," "enrolled in," "prefer," or "have characteristic." These phrases signal that organizing information visually will be more efficient than attempting purely algebraic approaches.
Time allocation: Allocate 2-2.5 minutes for two-set problems and 3-3.5 minutes for three-set problems. If a problem takes longer, mark it for review and move on—Venn diagram questions should not consume excessive time once the strategy is mastered.
Systematic approach:
- Read the entire problem first to identify how many sets are involved
- Draw the diagram immediately, even if roughly
- Label what you know, starting with intersections
- Write down the equation for the universal set total
- Solve for unknowns
- Double-check that all regions sum correctly
Process of elimination tips: If answer choices are given, use the universal set constraint to eliminate impossible answers. For example, if the universal set is 100 and an answer choice suggests a "neither" category of 120, eliminate it immediately. Also eliminate any answer that would require a negative number in any region of the diagram.
Common traps to avoid: The GRE often provides information in a confusing order or uses language designed to make students confuse "total in set A" with "only in set A." Always clarify whether a number represents a total or an exclusive category. Also watch for problems that give percentages for some information and raw numbers for others—convert to a single format before calculating.
Exam Tip: If a three-set problem seems overwhelming, remember that you can always use the inclusion-exclusion formula as a backup method or verification tool. Memorize this formula before test day.
Memory Techniques
Mnemonic for systematic labeling: "Center Out, Never Doubt" reminds students to start with the centermost region and work outward, which prevents double-counting errors.
Visualization strategy: Picture Venn diagrams as a target with the bullseye in the center. Just as you'd describe a target from center to outer rings, describe Venn diagram regions from innermost to outermost.
Acronym for two-set regions: "OBON" = Only A, Both, Only B, Neither—the four regions in order from left to right across the diagram.
Formula memory aid: For inclusion-exclusion with two sets, remember "Add the sets, Subtract the Overlap" (ASO). For three sets, extend this to "Add all Sets, Subtract all Pairs, Add the Triple" (ASSAT).
Phrase association: When you see "at least one," visualize all circles lighting up (the union). When you see "exactly one," visualize only the outer rings lighting up (excluding all overlaps).
Summary
Venn diagrams are essential visual tools for solving GRE problems involving overlapping sets and categories. Mastery requires understanding the structure of two-set and three-set diagrams, applying the inclusion-exclusion principle correctly, and using a systematic region-labeling strategy that works from the innermost intersection outward. The key to success is accurately translating word problems into diagrams, distinguishing between "total in a set" and "only in that set," and setting up algebraic equations that account for all regions. Students must recognize trigger phrases like "both," "neither," and "at least one," then organize information visually before attempting calculations. The most common errors involve double-counting intersections, forgetting the "neither" category, and mixing percentages with raw numbers. By drawing diagrams systematically, applying the inclusion-exclusion formula when needed, and verifying that all regions sum to the universal set total, students can solve these medium-difficulty problems efficiently and accurately, gaining a significant advantage on the GRE Quantitative Reasoning section.
Key Takeaways
- Always draw the Venn diagram, even if roughly—visual organization prevents calculation errors
- Start labeling from the innermost region (center) and work outward to avoid double-counting
- The inclusion-exclusion principle accounts for overlaps: for two sets, |A ∪ B| = |A| + |B| - |A ∩ B|
- "Total in set A" includes all overlaps; "only A" excludes overlaps—distinguish these carefully
- The "neither" category equals the universal set total minus the sum of all other regions
- Verify every solution by confirming all regions sum to the universal set total
- Three-set problems have eight distinct regions; systematically account for each one
Related Topics
Set Theory Fundamentals: Understanding formal set notation, operations (union, intersection, complement), and properties provides the mathematical foundation for more advanced Venn diagram applications and connects to discrete mathematics concepts.
Probability with Overlapping Events: Venn diagrams are frequently used to visualize probability problems involving non-mutually exclusive events, making this a natural next step after mastering basic Venn diagram techniques.
Data Interpretation Tables: Many GRE questions present set information in table format rather than as Venn diagrams, requiring students to extract relationships and potentially construct diagrams themselves.
Logical Reasoning and Categorical Statements: Venn diagrams can represent logical relationships between categories (all A are B, some A are C), connecting quantitative skills to verbal reasoning.
Counting Principles and Combinatorics: The inclusion-exclusion principle extends to more complex counting problems, making Venn diagram mastery a stepping stone to advanced combinatorial reasoning.
Practice CTA
Now that you've mastered the core concepts and strategies for GRE Venn diagrams, it's time to reinforce your learning through active practice. Attempt the practice questions designed specifically for this topic, focusing on applying the systematic labeling strategy and inclusion-exclusion principle. Use the flashcards to memorize key formulas and trigger phrases until they become automatic. Remember, Venn diagram problems are highly predictable once you recognize the patterns—consistent practice will transform these questions from challenging puzzles into reliable score-boosters. Your investment in mastering this high-yield topic will pay dividends on test day!
Sign up free to keep reading
Create a free AnvayaPrep account to finish this GRE guide on Venn diagrams — plus flashcards and practice questions.