Overview
Comparing areas is a fundamental skill tested extensively in the GRE Quantitative Reasoning section, particularly within Quantitative Comparison questions. This topic requires students to evaluate and compare the sizes of geometric figures—including rectangles, triangles, circles, and irregular shapes—often without performing complete calculations. The ability to quickly assess relative areas through strategic reasoning, estimation, and geometric principles distinguishes high-scoring test-takers from those who waste valuable time on unnecessary computations.
The GRE frequently presents area comparison problems that test spatial reasoning, formula application, and the ability to recognize when visual representations can be misleading. Questions may involve comparing areas of shapes with the same perimeter, evaluating how dimensional changes affect area, or determining relationships between composite figures. Success requires not just memorizing area formulas, but understanding the underlying mathematical relationships that govern how areas scale, transform, and relate to other geometric properties.
GRE comparing areas questions integrate seamlessly with broader Quantitative Reasoning concepts including algebraic manipulation, ratio and proportion, coordinate geometry, and data sufficiency. These problems often appear in Quantitative Comparison format, where determining the relationship between two quantities without calculating exact values becomes the most efficient approach. Mastering this topic builds critical thinking skills applicable across multiple question types and strengthens overall geometric intuition essential for achieving competitive scores.
Learning Objectives
- [ ] Identify when Comparing areas is being tested in GRE questions
- [ ] Explain the core rule or strategy behind Comparing areas
- [ ] Apply Comparing areas to GRE-style questions accurately
- [ ] Determine when exact calculation is necessary versus when estimation suffices
- [ ] Recognize how changes in linear dimensions affect area measurements
- [ ] Evaluate area relationships using algebraic expressions and inequalities
- [ ] Identify misleading visual representations and avoid diagram-based assumptions
Prerequisites
- Basic area formulas: Understanding formulas for rectangles, triangles, circles, and trapezoids is essential for any comparison task
- Algebraic manipulation: Simplifying expressions and solving equations enables comparison of areas expressed algebraically
- Perimeter concepts: Many area comparison questions involve the relationship between perimeter and area
- Ratio and proportion: Scaling relationships directly impact how areas change when dimensions are modified
- Coordinate geometry basics: Some area problems require plotting points or understanding distance in the coordinate plane
Why This Topic Matters
Area comparison questions appear in approximately 10-15% of GRE Quantitative Reasoning sections, making this a high-yield topic for focused study. These questions test multiple competencies simultaneously: geometric knowledge, algebraic reasoning, and strategic problem-solving. The GRE values this topic because it reveals whether students can think flexibly about mathematical relationships rather than simply memorizing procedures.
In real-world applications, comparing areas relates to optimization problems in architecture, resource allocation, land use planning, and materials science. Professionals regularly face decisions requiring quick spatial assessments without precise measurements—exactly the skill the GRE tests. Understanding area relationships also builds intuition for more advanced mathematical concepts in calculus, physics, and engineering.
On the exam, area comparison appears in multiple formats: Quantitative Comparison questions asking which of two quantities is greater, Problem Solving questions requiring calculation of specific values, and Data Sufficiency-style questions testing whether given information is adequate. Common scenarios include comparing rectangles with equal perimeters, evaluating how area changes when dimensions are doubled or halved, comparing inscribed versus circumscribed figures, and analyzing composite shapes formed by combining or subtracting basic figures.
Core Concepts
Fundamental Area Formulas
Before comparing areas, students must have instant recall of essential formulas:
| Shape | Area Formula | Key Variables |
|---|---|---|
| Rectangle | A = length × width | l, w |
| Square | A = s² | s (side length) |
| Triangle | A = ½ × base × height | b, h |
| Circle | A = πr² | r (radius) |
| Trapezoid | A = ½(b₁ + b₂)h | b₁, b₂ (bases), h (height) |
| Parallelogram | A = base × height | b, h |
The GRE expects automatic application of these formulas, as questions rarely provide them. Understanding that area always involves two-dimensional measurement (length units squared) helps verify calculations and catch errors.
Scaling Relationships and Dimensional Analysis
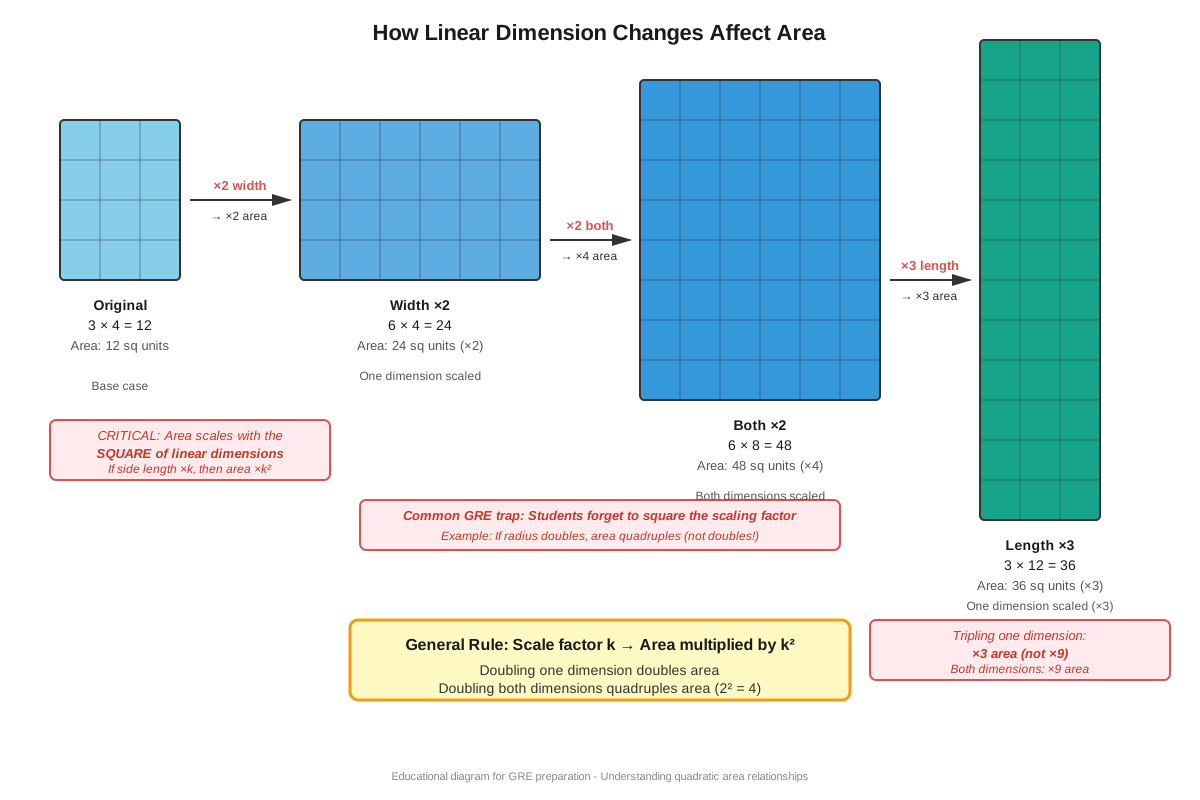
One of the most powerful concepts in GRE comparing areas is understanding how area scales with linear dimensions. When all linear dimensions of a figure are multiplied by a factor k, the area is multiplied by k². This relationship appears frequently in comparison questions.
Example: If a rectangle has dimensions 3 × 4 (area = 12), doubling both dimensions creates a 6 × 8 rectangle with area 48. The linear scale factor is 2, but the area scale factor is 2² = 4, so the new area is 4 times the original.
This principle applies universally:
- Tripling all dimensions multiplies area by 9
- Halving all dimensions divides area by 4
- Multiplying dimensions by 1.5 multiplies area by 2.25
Understanding this relationship allows rapid comparison without complete calculation. If Quantity A is a triangle with base 6 and height 8, and Quantity B is a similar triangle with base 9 and height 12, recognizing the 1.5 scale factor immediately reveals that Quantity B has area 2.25 times Quantity A.
Perimeter-Area Relationships
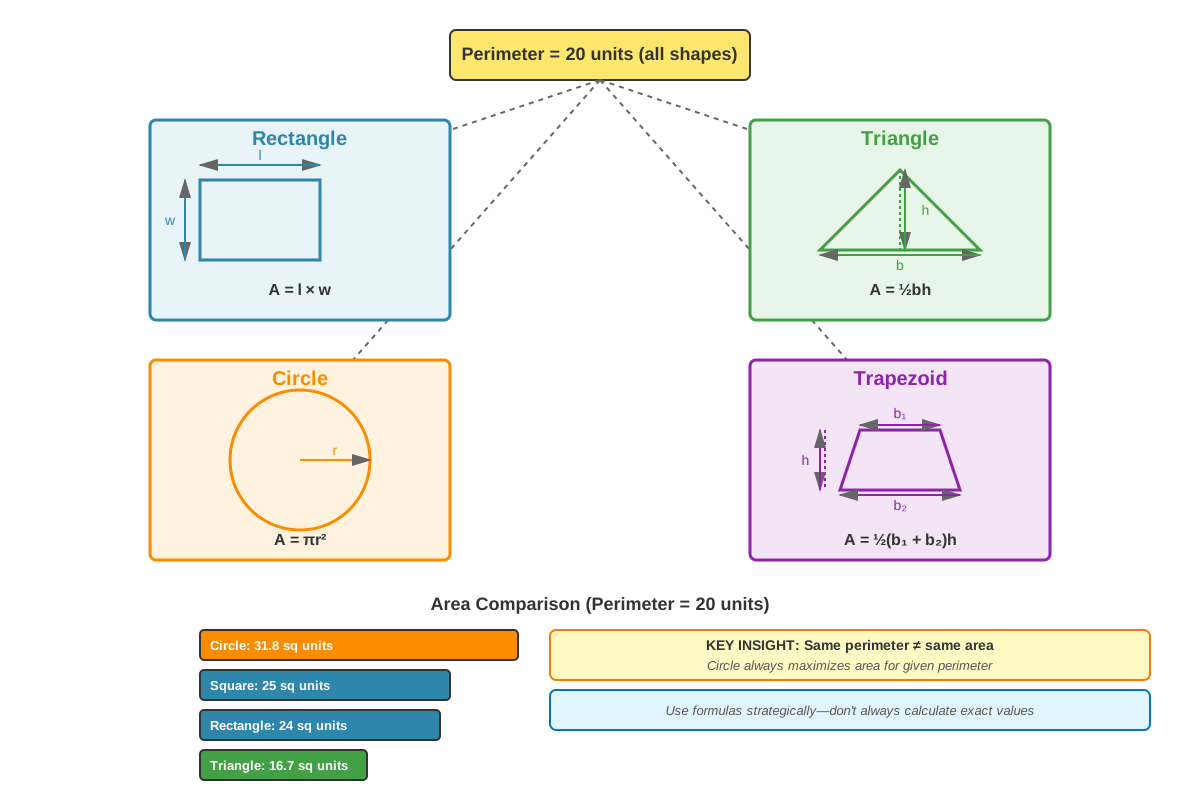
A critical insight for area comparison is that perimeter and area are independent variables. Figures with identical perimeters can have vastly different areas, and figures with identical areas can have different perimeters. The GRE exploits this counterintuitive fact extensively.
Key principle: Among all rectangles with a given perimeter, the square has the maximum area. Among all shapes with a given perimeter, the circle has the maximum area.
Consider rectangles with perimeter 20:
- 1 × 9 rectangle: Area = 9
- 2 × 8 rectangle: Area = 16
- 3 × 7 rectangle: Area = 21
- 4 × 6 rectangle: Area = 24
- 5 × 5 square: Area = 25
As the rectangle approaches a square shape, area increases. This principle helps quickly determine relationships in comparison questions.
Visual Deception and Diagram Limitations
The GRE explicitly states "figures are not necessarily drawn to scale" to prevent reliance on visual estimation. This warning is particularly important for area comparisons, where diagrams can be deliberately misleading.
Critical rule: Never assume relative sizes based on appearance. Always use given measurements and geometric principles.
A diagram might show a triangle appearing larger than a rectangle, but calculations could prove otherwise. Successful test-takers ignore visual impressions and rely exclusively on quantitative analysis. When no measurements are provided, the answer is typically "the relationship cannot be determined" (choice D in Quantitative Comparison).
Composite Figures and Area Addition/Subtraction
Many GRE area problems involve composite figures—shapes formed by combining or removing basic geometric figures. The fundamental approach involves:
- Decompose the composite figure into recognizable shapes
- Calculate or express the area of each component
- Add or subtract areas as appropriate
- Compare the resulting expressions or values
For example, an L-shaped figure can be divided into two rectangles, or viewed as a large rectangle with a rectangular piece removed. Both approaches yield the same result, but one may be computationally simpler depending on given information.
Algebraic Area Expressions
When dimensions are given as variables, comparing areas requires algebraic manipulation. The process involves:
- Express each area as an algebraic formula
- Simplify both expressions
- Determine the relationship by factoring, expanding, or substituting values
- Consider whether the relationship holds for all valid values or depends on specific conditions
Example: Compare the area of a rectangle with dimensions x and (x + 2) versus a square with side length (x + 1).
- Rectangle area: x(x + 2) = x² + 2x
- Square area: (x + 1)² = x² + 2x + 1
The square's area is always 1 unit greater, regardless of x's value (for positive x).
Special Cases and Boundary Conditions
Certain configurations create predictable area relationships:
- Inscribed vs. circumscribed figures: A circle inscribed in a square has area πr², while the square has area (2r)² = 4r². The ratio is always π:4 ≈ 0.785
- Right triangles in rectangles: A right triangle with legs forming a rectangle's dimensions has exactly half the rectangle's area
- Diagonal divisions: A diagonal divides any parallelogram into two equal areas
- Similar figures: If two figures are similar with linear scale factor k, their areas have ratio k²
Concept Relationships
The concepts within area comparison form an interconnected system. Fundamental area formulas serve as the foundation, enabling all calculations. These formulas connect to scaling relationships, which explain how dimensional changes propagate to area changes. Understanding that area scales with the square of linear dimensions directly informs analysis of similar figures and proportional reasoning.
Perimeter-area independence represents a crucial conceptual distinction that prevents common errors. This principle connects to optimization concepts, explaining why certain shapes maximize or minimize area for given constraints. The relationship flows: perimeter constraints → shape optimization → area maximization/minimization.
Algebraic area expressions build upon formula knowledge, extending it to variable-based reasoning. This connects to composite figures, where algebraic thinking enables systematic decomposition and recombination of areas. Both concepts require strong algebraic manipulation skills from prerequisite knowledge.
Visual deception awareness acts as a meta-cognitive safeguard, reminding students to verify rather than assume. This connects to all other concepts by emphasizing quantitative verification over intuitive judgment.
The progression for mastery follows: Formula memorization → Scaling understanding → Perimeter-area distinction → Algebraic generalization → Composite figure analysis → Strategic comparison without full calculation.
Quick check — test yourself on Comparing areas so far.
Try Flashcards →High-Yield Facts
⭐ Area scales with the square of linear dimensions: If all dimensions are multiplied by k, area is multiplied by k²
⭐ Among rectangles with fixed perimeter, the square has maximum area: As length and width become more equal, area increases
⭐ Perimeter and area are independent: Equal perimeters do not imply equal areas, and vice versa
⭐ A circle inscribed in a square has area π/4 times the square's area: Approximately 78.5% of the square's area
⭐ Doubling one dimension of a rectangle doubles its area: If only length or width changes, area changes proportionally
- A diagonal divides any quadrilateral into two regions, but only divides parallelograms into equal areas
- The area of a triangle with base b and height h is always half the area of a rectangle with dimensions b × h
- Similar figures have areas in the ratio of their corresponding linear dimensions squared
- A circle has the maximum area among all shapes with a given perimeter
- When comparing areas algebraically, factoring often reveals relationships more clearly than expanding
- The area of a trapezoid equals the area of a rectangle with width equal to the trapezoid's height and length equal to the average of the two bases
- Rotating or reflecting a figure does not change its area
- If a rectangle's length increases by x% and width decreases by x%, the area decreases (except when x = 0)
- The area between two concentric circles equals π(R² - r²), where R and r are the outer and inner radii
- For a right triangle inscribed in a semicircle, the hypotenuse equals the diameter, and the area can be calculated using the two legs as base and height
Common Misconceptions
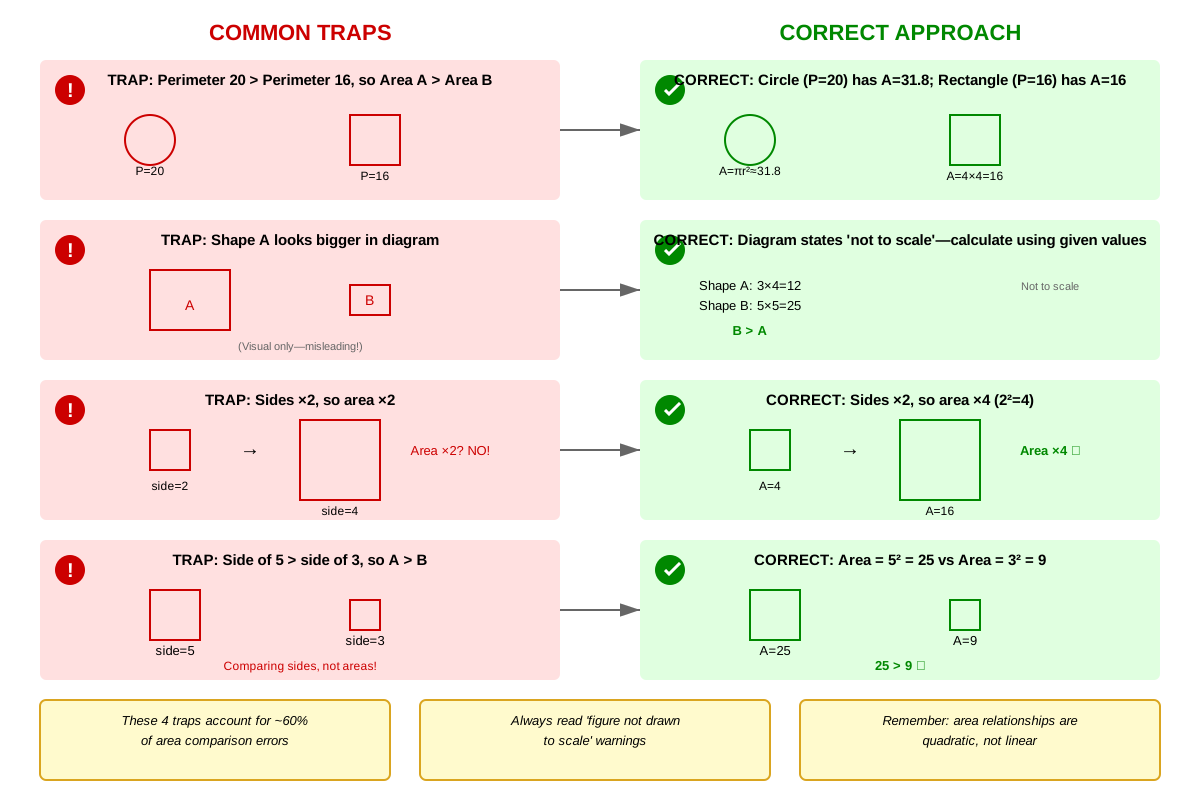
Misconception: Figures with equal perimeters have equal areas → Correction: Perimeter and area are independent properties. A 1×9 rectangle and a 5×5 square both have perimeter 20, but areas of 9 and 25 respectively. Shape matters significantly.
Misconception: If a diagram shows one figure appearing larger, it has greater area → Correction: GRE diagrams are explicitly not drawn to scale. Only use given measurements and calculations to determine area relationships. Visual appearance is often deliberately misleading.
Misconception: Doubling the dimensions of a figure doubles its area → Correction: Doubling all linear dimensions multiplies area by 4 (2²), not 2. This is the most common scaling error. Only when one dimension doubles while others remain constant does area double.
Misconception: A triangle and rectangle with the same base and height have equal areas → Correction: The triangle's area is exactly half the rectangle's area. The formula A = ½bh for triangles includes the factor ½ precisely because of this relationship.
Misconception: Increasing one dimension and decreasing another by the same amount leaves area unchanged → Correction: This only works for addition/subtraction when the changes are equal absolute amounts and the figure is a rectangle. For example, a 4×5 rectangle (area 20) changed to 3×6 has area 18, not 20. The relationship is multiplicative, not additive.
Misconception: The area of a circle with diameter d is πd² → Correction: The formula A = πr² uses radius, not diameter. With diameter d, the radius is d/2, so area = π(d/2)² = πd²/4. Confusing radius and diameter is a frequent error.
Misconception: If two shapes have the same area, they are congruent → Correction: Shapes can have identical areas while having completely different shapes, dimensions, and perimeters. A 2×8 rectangle and a 4×4 square both have area 16 but are not congruent.
Worked Examples
Example 1: Quantitative Comparison with Scaling
Question:
- Quantity A: The area of a rectangle with length 6 and width 4
- Quantity B: The area of a rectangle with length 9 and width 6
Solution:
First, recognize this as a scaling problem. Compare the dimensions:
- Length ratio: 9/6 = 1.5
- Width ratio: 6/4 = 1.5
Both dimensions are scaled by the same factor (1.5), meaning these are similar rectangles.
Method 1 (Using scaling principle):
When all dimensions scale by factor k, area scales by k². Here k = 1.5, so:
- Area scale factor = (1.5)² = 2.25
- Quantity B = 2.25 × Quantity A
Therefore, Quantity B is greater.
Method 2 (Direct calculation):
- Quantity A: 6 × 4 = 24
- Quantity B: 9 × 6 = 54
- 54/24 = 2.25
Quantity B is greater.
Connection to learning objectives: This example demonstrates identifying when area comparison is tested (similar rectangles with proportional dimensions), applying the core scaling strategy (area scales with k²), and solving accurately using either strategic reasoning or direct calculation.
Example 2: Perimeter-Area Independence
Question:
Two rectangles each have perimeter 24.
- Rectangle P has length 8
- Rectangle Q has length 10
- Quantity A: Area of Rectangle P
- Quantity B: Area of Rectangle Q
Solution:
This tests understanding that equal perimeters don't guarantee equal areas.
Step 1: Find the width of each rectangle using perimeter formula P = 2(l + w)
Rectangle P:
- 24 = 2(8 + w)
- 12 = 8 + w
- w = 4
Rectangle Q:
- 24 = 2(10 + w)
- 12 = 10 + w
- w = 2
Step 2: Calculate areas
- Quantity A: 8 × 4 = 32
- Quantity B: 10 × 2 = 20
Step 3: Compare
Quantity A is greater.
Key insight: Rectangle P is closer to a square (8×4 vs. 10×2), and among rectangles with equal perimeter, those closer to square shape have larger area. Rectangle Q is more elongated, resulting in smaller area despite identical perimeter.
Connection to learning objectives: This demonstrates recognizing perimeter-area relationships, applying the principle that squares maximize area for given perimeter, and accurately solving comparison questions involving constraints.
Exam Strategy
Trigger Words and Phrases
Watch for these indicators that area comparison is being tested:
- "Compare the areas of..."
- "Which has greater area..."
- "Same perimeter" or "equal perimeter" (signals perimeter-area independence)
- "Dimensions are doubled/tripled/halved" (signals scaling relationships)
- "Inscribed" or "circumscribed" (signals special geometric relationships)
- "Similar figures" (signals k² area scaling)
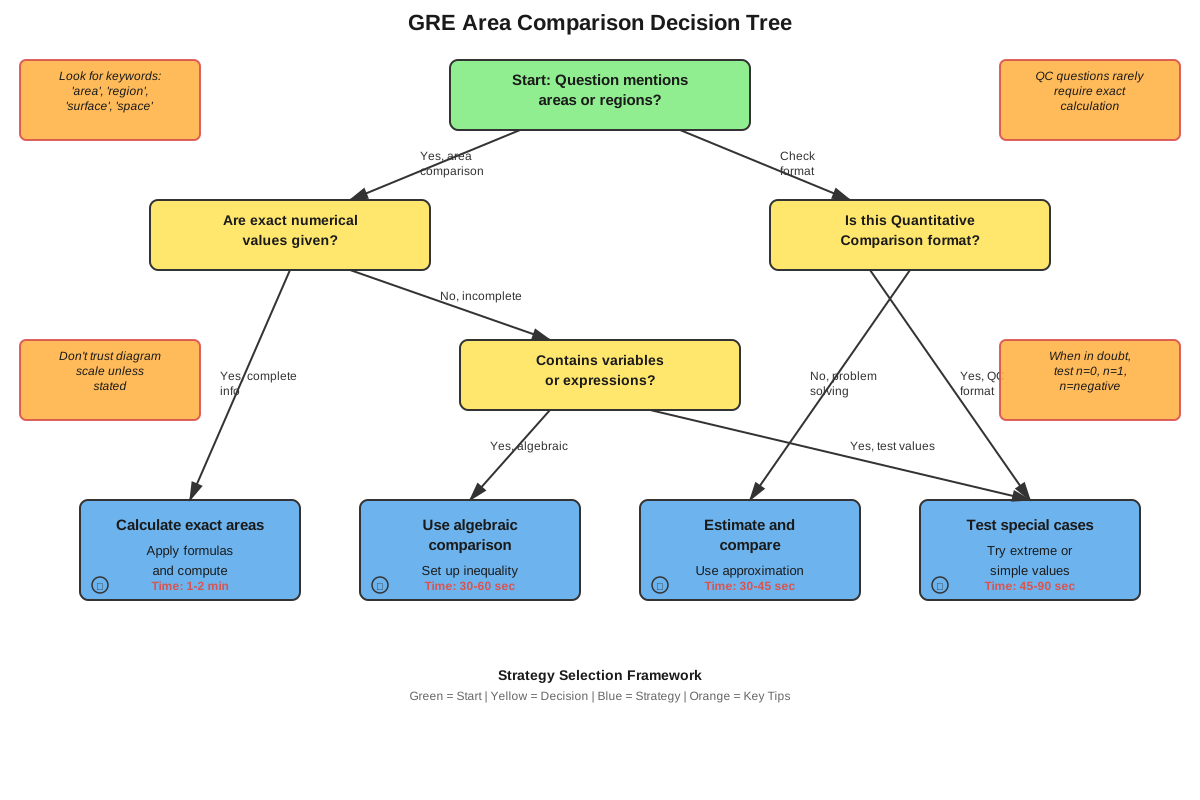
Strategic Approach
Step 1: Identify the question type
- Quantitative Comparison: Determine relationship without necessarily finding exact values
- Problem Solving: Calculate specific area values
- Data Sufficiency: Determine if given information is adequate
Step 2: Assess whether calculation is necessary
- Can scaling relationships determine the answer?
- Does one quantity obviously dominate?
- Are algebraic expressions sufficient without substitution?
Step 3: Choose the most efficient method
- Direct calculation when dimensions are simple numbers
- Scaling analysis when figures are similar
- Algebraic comparison when variables are involved
- Estimation when answer choices are widely spaced
Step 4: Verify reasonableness
- Check units (area should be square units)
- Confirm scaling makes sense (larger dimensions → larger area)
- Ensure perimeter-area logic is sound
Time Management
Allocate approximately:
- 30 seconds: Reading and identifying the problem type
- 60 seconds: Setting up the comparison or calculation
- 30 seconds: Solving and verifying
For Quantitative Comparison questions, avoid calculating exact values when relationships can be determined through:
- Factoring and simplification
- Recognizing special ratios (π/4 for inscribed circles, 1/2 for triangles in rectangles)
- Scaling principles
Process of Elimination
When uncertain:
- Eliminate choices that violate basic principles (e.g., doubled dimensions can't merely double area)
- Test extreme values for algebraic expressions
- Check if the relationship depends on unknown variables (suggesting "cannot be determined")
- Verify that visual appearance doesn't contradict calculations
Memory Techniques
Acronym: SCALE
Square of linear factor determines area scaling
Circle maximizes area for given perimeter
Always verify; don't trust diagrams
Larger perimeter doesn't mean larger area
Equal areas don't mean equal shapes
Visualization Strategy
The Square Rule: Picture a square as the "optimal" rectangle. Any deviation from square shape (making it more rectangular) with the same perimeter reduces area. Visualize the square "bulging" in the middle—this represents maximum area.
The Scaling Grid: When dimensions scale by factor k, visualize a grid. If you double dimensions, you create a 2×2 grid of the original figure (4 copies), so area quadruples. If you triple dimensions, you create a 3×3 grid (9 copies).
Mnemonic for Common Ratios
"Pie For Squares" (π/4): A circle inscribed in a square has area π/4 times the square's area (approximately 0.785 or 78.5%).
"Half the Rectangle": A triangle with the same base and height as a rectangle has half the area—visualize the diagonal cutting the rectangle in half.
Formula Memory Aid
"Radius Squared, Pi's Prepared": For circles, always square the radius first, then multiply by π. This prevents the common error of using diameter.
"Base Times Height, Divide by Two for Triangle's Might": Reinforces that triangles are half the corresponding rectangle.
Summary
Comparing areas on the GRE requires mastery of fundamental geometric formulas combined with strategic reasoning about relationships between dimensions and areas. The most critical principle is that area scales with the square of linear dimensions—doubling all dimensions quadruples area, not doubles it. Equally important is recognizing that perimeter and area are independent properties; shapes with identical perimeters can have vastly different areas, with squares maximizing area among rectangles with fixed perimeter. Success on these questions demands ignoring potentially misleading diagrams and relying exclusively on calculations and geometric principles. Efficient test-takers recognize when scaling relationships, algebraic manipulation, or special geometric configurations (like inscribed circles or triangles in rectangles) allow comparison without complete calculation. The ability to decompose composite figures, work with algebraic expressions for area, and apply ratio reasoning distinguishes high scorers. Understanding these concepts enables rapid, accurate responses to the 10-15% of Quantitative Reasoning questions involving area comparison, making this a high-yield topic for focused preparation.
Key Takeaways
- Area scales with the square of linear dimensions (k² rule), not linearly with dimension changes
- Perimeter and area are independent; equal perimeters do not imply equal areas
- Among rectangles with fixed perimeter, squares have maximum area; elongated rectangles have less area
- Never rely on diagram appearance—GRE figures are not drawn to scale
- Inscribed circles have area π/4 ≈ 0.785 times the area of their circumscribing squares
- Triangles have exactly half the area of rectangles with the same base and height
- Strategic comparison using scaling and algebraic relationships is faster than complete calculation for many problems
Related Topics
Quantitative Comparison Strategies: Mastering area comparison strengthens general Quantitative Comparison skills, including when to calculate versus estimate, how to manipulate algebraic expressions for comparison, and recognizing when relationships cannot be determined.
Volume Comparison: Understanding that area scales with k² naturally extends to volume scaling with k³, enabling mastery of three-dimensional comparison problems.
Coordinate Geometry: Area comparison skills apply to finding areas of polygons plotted on coordinate planes, connecting geometric and algebraic reasoning.
Optimization Problems: The principle that squares maximize area for given perimeter extends to broader optimization concepts tested in Problem Solving questions.
Ratio and Proportion: Area comparison reinforces proportional reasoning, particularly understanding how ratios of linear dimensions relate to ratios of areas.
Practice CTA
Now that you've mastered the core concepts and strategies for comparing areas, it's time to solidify your understanding through active practice. Attempt the practice questions designed specifically for this topic, focusing on applying the k² scaling rule, recognizing perimeter-area independence, and choosing efficient solution methods. Use the flashcards to reinforce formula recall and key principles until they become automatic. Remember: the GRE rewards strategic thinking over brute-force calculation—practice identifying when you can determine relationships without computing exact values. Your investment in mastering this high-yield topic will pay dividends across multiple question types on test day!
Sign up free to keep reading
Create a free AnvayaPrep account to finish this GRE guide on Comparing areas — plus flashcards and practice questions.