Overview
Comparing averages is a critical quantitative reasoning skill that appears frequently on the GRE, particularly in Quantitative Comparison questions where test-takers must determine the relationship between two quantities without necessarily calculating exact values. This topic tests the ability to reason about central tendency measures—primarily arithmetic means—across different data sets, groups, or conditions. Success requires understanding not just how to calculate averages, but how changes in data sets affect average values, how to compare averages without complete information, and how to recognize when sufficient information exists to make a determination.
The GRE frequently presents GRE comparing averages problems that require strategic thinking rather than brute-force calculation. These questions assess whether students can identify relationships between averages based on partial information, understand how adding or removing data points affects means, and recognize when two averages can be definitively compared versus when the relationship remains indeterminate. This skill bridges computational ability with logical reasoning, making it a high-yield topic that distinguishes strong quantitative performers from average test-takers.
Within the broader Quantitative Reasoning framework, comparing averages connects to fundamental statistical concepts, algebraic manipulation, and inequality reasoning. It requires facility with weighted averages, understanding of how outliers influence means, and the ability to work with constraints and ranges. This topic also intersects with data interpretation, problem-solving strategies, and the critical GRE skill of determining sufficiency—knowing when enough information exists to reach a conclusion versus when multiple outcomes remain possible.
Learning Objectives
- [ ] Identify when Comparing averages is being tested in GRE questions
- [ ] Explain the core rule or strategy behind Comparing averages
- [ ] Apply Comparing averages to GRE-style questions accurately
- [ ] Determine when sufficient information exists to compare two averages definitively
- [ ] Analyze how adding, removing, or changing data points affects average values
- [ ] Recognize common trap patterns in average comparison questions
- [ ] Apply weighted average principles to compare groups of different sizes
Prerequisites
- Arithmetic mean calculation: Understanding how to compute the sum of values divided by the count is fundamental to all average comparisons
- Basic algebra: Manipulating equations involving sums and counts enables strategic problem-solving without exhaustive calculation
- Inequality reasoning: Comparing averages requires determining greater than, less than, or equal relationships between quantities
- Quantitative Comparison format: Familiarity with the four answer choices (A, B, C, D) and when each applies is essential for this question type
Why This Topic Matters
In real-world contexts, comparing averages enables informed decision-making across countless domains: evaluating investment returns across portfolios, comparing student performance between classes, analyzing salary differences between departments, or assessing product ratings across categories. The ability to reason about averages without complete data mirrors practical situations where decisions must be made with partial information—a crucial professional skill.
On the GRE, comparing averages appears in approximately 10-15% of Quantitative Reasoning questions, with particularly high frequency in Quantitative Comparison sections. The Educational Testing Service (ETS) favors this topic because it efficiently tests multiple competencies simultaneously: computational accuracy, logical reasoning, strategic thinking, and the ability to recognize when information is insufficient. Questions range from straightforward comparisons to complex scenarios involving weighted averages, combined groups, or conditional constraints.
This topic commonly appears in several formats: direct comparisons of two group averages given partial information; questions about how adding or removing values affects an average; scenarios involving combined groups where individual group averages must be compared to the overall average; and problems requiring recognition that the relationship cannot be determined from given information. The GRE particularly favors questions where the intuitive answer is incorrect, making this a high-value topic for score improvement.
Core Concepts
Fundamental Average Comparison Principles
The arithmetic mean (average) of a data set equals the sum of all values divided by the count of values. When comparing averages between two groups, the relationship depends on the relationship between their respective sums and counts. For groups A and B with averages μ_A and μ_B:
μ_A > μ_B if and only if (Sum_A / Count_A) > (Sum_B / Count_B)This can be rewritten as: Sum_A × Count_B > Sum_B × Count_A, which often provides a more strategic comparison method than calculating both averages explicitly.
A critical principle: you cannot always determine the relationship between two averages from partial information. The GRE exploits this by presenting scenarios where test-takers assume they can make a determination when they actually cannot, or conversely, fail to recognize when sufficient information exists.
Effect of Adding or Removing Values
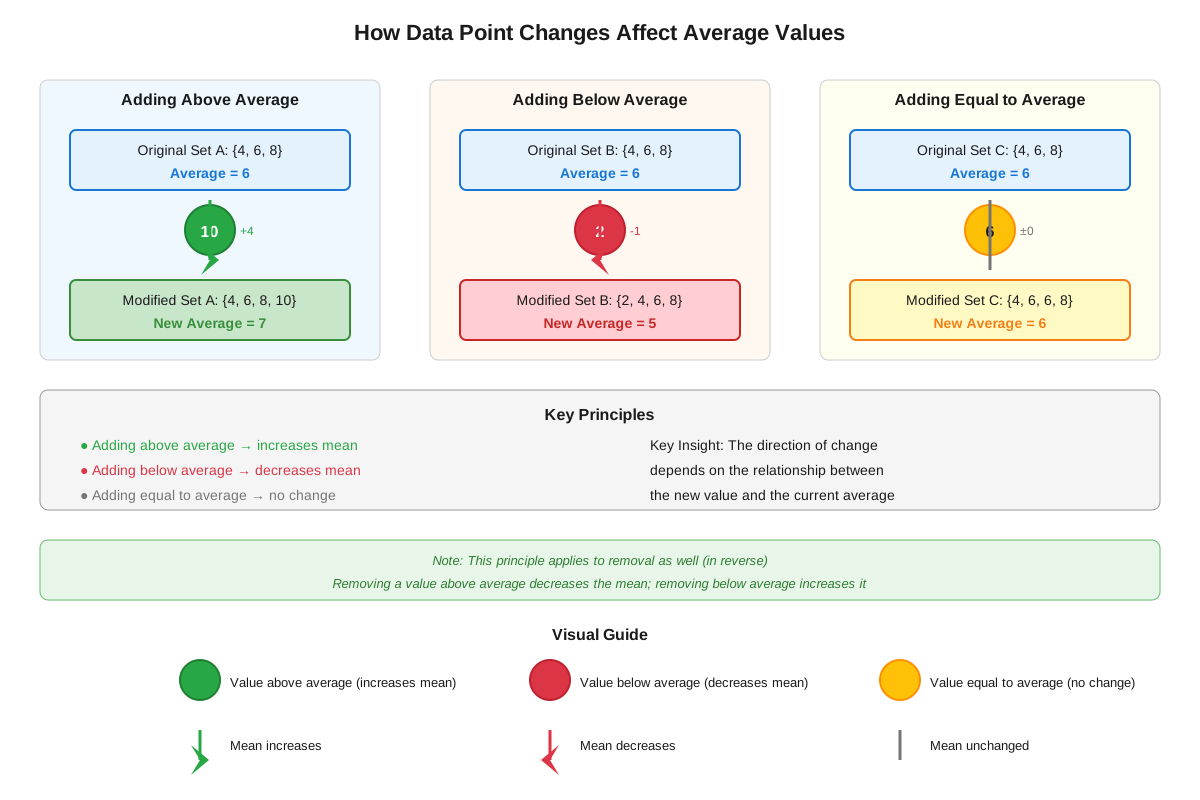
When a value is added to a data set, the new average shifts toward that value. Specifically:
- Adding a value greater than the current average increases the average
- Adding a value less than the current average decreases the average
- Adding a value equal to the current average maintains the average unchanged
The magnitude of change depends on the data set size. Adding a value to a small set causes a larger average shift than adding the same value to a large set. If a set has n values with average μ, and value x is added:
New average = (n × μ + x) / (n + 1)Conversely, when removing a value from a data set, the average shifts away from that value. Removing a value above the average increases the remaining values' average; removing a value below the average decreases it.
Comparing Combined Group Averages
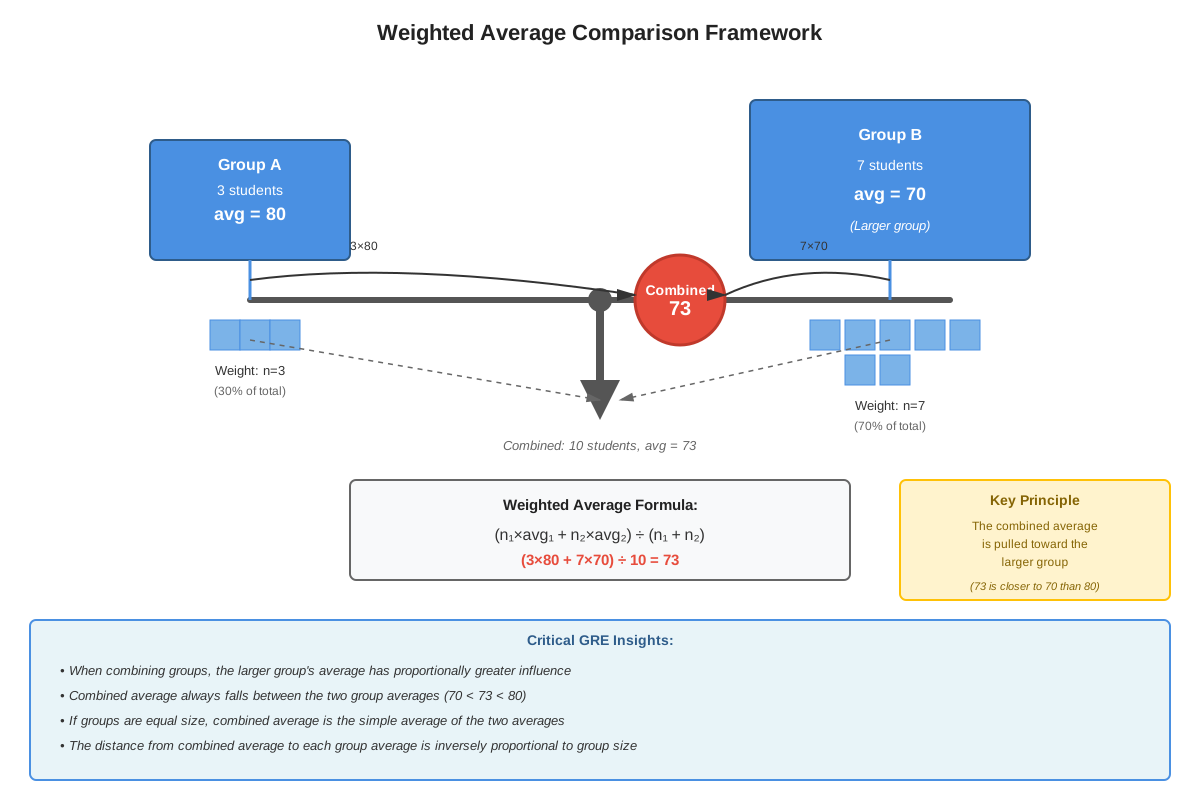
When two groups are combined, the overall average is the weighted average of the individual group averages, weighted by group sizes. For Group 1 (n₁ values, average μ₁) and Group 2 (n₂ values, average μ₂):
Combined average = (n₁ × μ₁ + n₂ × μ₂) / (n₁ + n₂)Critical insight: The combined average always falls between the two individual averages (assuming they differ), and lies closer to the average of the larger group. If the groups are equal in size, the combined average is exactly halfway between the two individual averages.
This principle enables powerful comparisons. If Group A has a higher average than Group B, and Group A is larger, then the combined average will be closer to Group A's average. This relationship holds regardless of the specific values.
Comparing Averages with Constraints
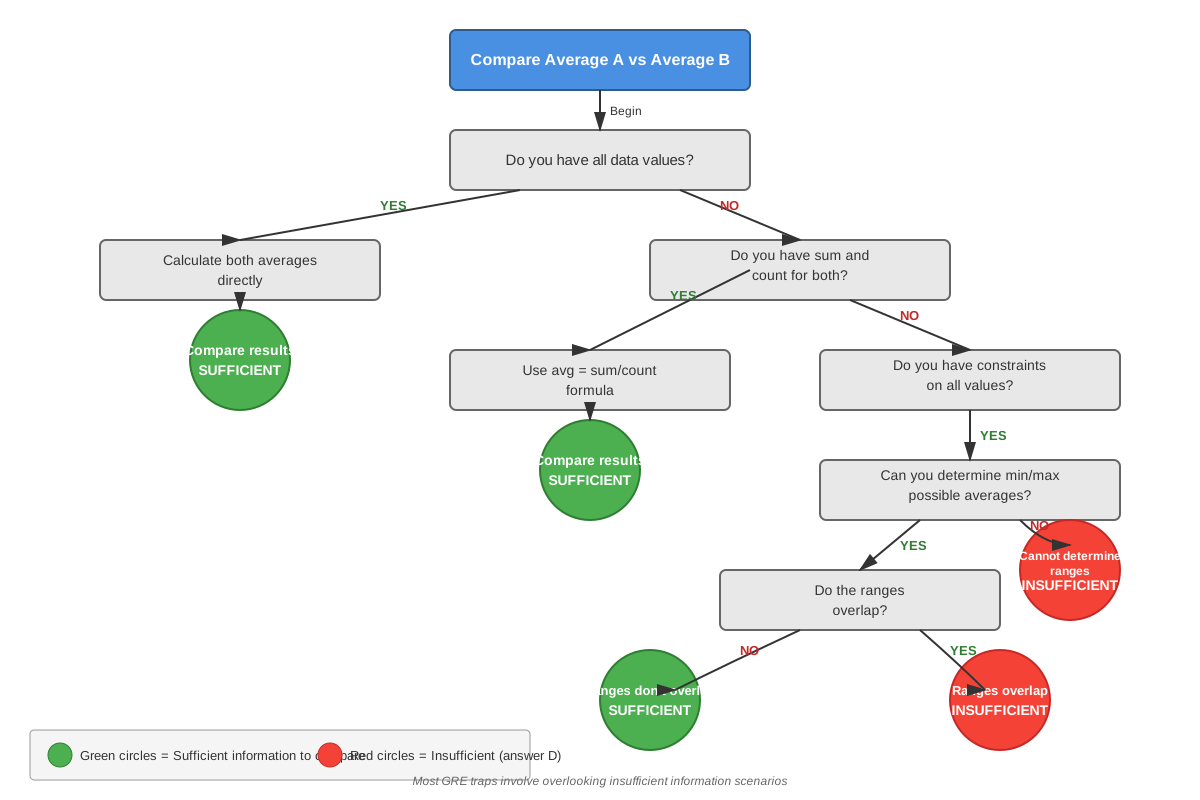
Many GRE problems provide constraints rather than exact values: "all values in Set A are positive integers less than 10" or "Set B contains five consecutive integers." Strategic comparison requires:
- Identifying the range of possible averages for each set given the constraints
- Determining whether these ranges overlap or one range entirely exceeds the other
- Recognizing when ranges overlap means the relationship cannot be determined
For example, if Set A contains three positive integers and Set B contains three integers between 5 and 10 inclusive, Set A's average could range from 1 to infinity (no upper bound given), while Set B's average ranges from 5 to 10. Since these ranges overlap, the relationship cannot be determined without additional information.
The Sufficiency Principle
A cornerstone of GRE comparing averages questions is recognizing when information is sufficient versus insufficient. Information is sufficient when:
- Exact values for all data points are provided
- Constraints definitively establish one average must exceed the other
- Algebraic relationships force a particular ordering
Information is insufficient when:
- Ranges of possible values overlap between the two sets
- The number of data points is unknown and affects the comparison
- Multiple scenarios consistent with the given information yield different orderings
The GRE frequently presents answer choice D ("The relationship cannot be determined") as correct, testing whether students recognize insufficiency rather than making unjustified assumptions.
Special Cases and Edge Conditions
Several special cases warrant attention:
| Scenario | Comparison Result |
|---|---|
| Both sets contain identical values | Averages are equal |
| One set is a subset of another with additional values equal to the average | Averages are equal |
| Sets have same sum but different counts | Set with fewer values has higher average |
| Sets have same count but different sums | Set with larger sum has higher average |
| One value is added to both sets | The set with fewer original values experiences larger average change |
Zero and negative values require careful consideration. A set containing negative values can have a negative average, and adding a positive value (even a large one) might still result in a negative average if the sum remains negative.
Concept Relationships
The core concepts within comparing averages form an interconnected logical framework. The fundamental comparison principle serves as the foundation, establishing that average comparisons ultimately reduce to comparing weighted sums. This principle directly enables the effect of adding/removing values concept, since adding a value changes the sum and count in predictable ways that can be analyzed without recalculation.
The combined group averages concept builds on the fundamental principle by applying it to scenarios where two groups merge, creating a weighted average situation. This connects to the sufficiency principle because determining whether combined averages can be compared often depends on knowing group sizes (the weights).
Comparing averages with constraints integrates all other concepts, requiring understanding of how ranges of possible values interact with the fundamental comparison principle, how adding values affects averages, and critically, when sufficient information exists to make a determination.
The relationship map flows as:
Fundamental Comparison Principle → Effect of Adding/Removing Values → Combined Group Averages → Sufficiency Principle → Comparing with Constraints
This topic connects to prerequisite knowledge of basic algebra (manipulating the average formula), arithmetic (calculating sums and quotients), and inequality reasoning (determining greater than/less than relationships). It extends to more advanced topics including standard deviation (which measures spread around the average), median comparisons (an alternative measure of central tendency), and weighted average problems in various contexts.
High-Yield Facts
⭐ The average of a combined group always falls between the individual group averages and is closer to the average of the larger group
⭐ Adding a value above the current average increases the average; adding a value below the current average decreases it
⭐ If all values in Set A exceed all values in Set B, then the average of Set A exceeds the average of Set B
⭐ When comparing averages, you can compare (Sum_A × Count_B) versus (Sum_B × Count_A) instead of calculating both averages
⭐ The relationship between two averages cannot be determined if the ranges of possible values overlap
- The average of n identical values equals that value regardless of n
- Removing the maximum value from a set decreases the average; removing the minimum value increases it
- If two sets have the same sum, the set with fewer elements has the higher average
- Adding the same value to every element in a set increases the average by that value
- The average of consecutive integers equals the median (middle value or average of two middle values)
- Multiplying every value in a set by a constant k multiplies the average by k
- If Set A's average exceeds Set B's average, and a value is added to both sets, the relationship between new averages depends on the value added and set sizes
- For sets with positive values only, the average must be positive; for sets with negative values only, the average must be negative
- The average of a set containing n values cannot be determined from knowing only n-1 of those values without additional constraints
- When comparing averages of sets with different sizes, size matters: a small difference in averages can represent a large difference in sums for large sets
Quick check — test yourself on Comparing averages so far.
Try Flashcards →Common Misconceptions
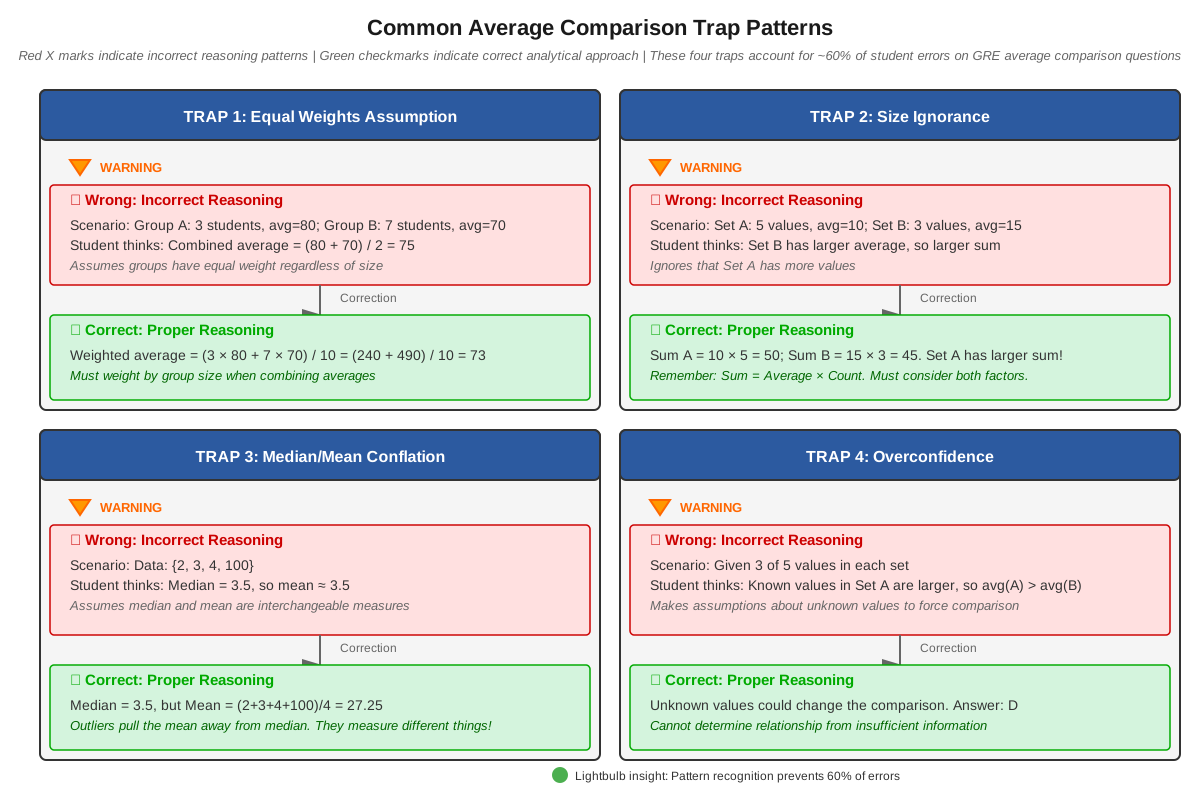
Misconception: If Set A has more elements than Set B, Set A must have a larger sum and therefore a larger average.
Correction: The number of elements alone does not determine the average. A set with many small values can have a lower average than a set with fewer large values. Average depends on both sum and count: μ = Sum/Count.
Misconception: When combining two groups with different averages, the combined average is always the arithmetic mean of the two individual averages.
Correction: The combined average is the weighted average, weighted by group sizes. Only when groups are equal in size does the combined average equal the simple average of the two group averages. Otherwise, it lies closer to the larger group's average.
Misconception: If you know the average of a set and add one value to it, you need to know all original values to determine the new average.
Correction: You only need the original average, the count of original values, and the new value. Use the formula: New average = (n × old average + new value)/(n + 1).
Misconception: If Set A's average is 50 and Set B's average is 40, then Set A's sum must be larger than Set B's sum.
Correction: The sum depends on both average and count. If Set B has significantly more elements, its sum could exceed Set A's sum despite the lower average. For example, Set A: {50, 50} has sum 100; Set B: {40, 40, 40} has sum 120.
Misconception: When comparing two averages with partial information, there's always a way to determine the relationship through clever reasoning.
Correction: Some scenarios genuinely lack sufficient information to determine the relationship. Recognizing insufficiency is a tested skill. If ranges of possible values overlap, the relationship cannot be determined without additional constraints.
Misconception: Adding a positive value to a set always increases its average.
Correction: Adding a positive value increases the average only if that value exceeds the current average. Adding a positive value smaller than the current average decreases the average. For example, if the average is 100, adding 50 decreases the average.
Misconception: If two sets have the same average, they must have the same sum.
Correction: Sets with the same average but different counts have different sums. Sum = Average × Count, so if counts differ, sums differ proportionally even when averages match.
Worked Examples
Example 1: Comparing Averages with Partial Information
Problem:
Quantity A: The average of 5, 8, 12, and x, where x is a positive integer
Quantity B: 10
Which quantity is greater?
Solution:
First, identify what we know and what we need to determine. We're comparing an average that depends on an unknown value x to the constant 10.
Calculate the sum of known values: 5 + 8 + 12 = 25
The average of the four values is: (25 + x)/4
We need to determine when (25 + x)/4 compares to 10.
Set up the comparison:
- If (25 + x)/4 > 10, then Quantity A is greater
- If (25 + x)/4 < 10, then Quantity B is greater
- If (25 + x)/4 = 10, then quantities are equal
Solve for the critical value:
(25 + x)/4 = 10
25 + x = 40
x = 15
Analysis of cases:
- If x > 15: Quantity A > 10, so Quantity A is greater
- If x < 15: Quantity A < 10, so Quantity B is greater
- If x = 15: Quantity A = 10, so quantities are equal
Since x is described only as "a positive integer" with no further constraints, x could be 1, 2, 3, ... 14 (making Quantity B greater), x could equal 15 (making them equal), or x could be 16, 17, 18, ... (making Quantity A greater).
Answer: D (The relationship cannot be determined from the information given)
Key insight: This problem tests the sufficiency principle. The range of possible values for x allows multiple different relationships, so no single answer applies to all cases. Recognizing this requires checking whether the unknown value could fall on either side of the critical threshold.
Example 2: Combined Group Averages
Problem:
Class A has 20 students with an average test score of 85. Class B has 30 students with an average test score of 78.
Quantity A: The average score of all 50 students combined
Quantity B: 81
Solution:
This tests understanding of weighted averages when combining groups.
Calculate the total points for each class:
- Class A total: 20 students × 85 average = 1,700 points
- Class B total: 30 students × 78 average = 2,340 points
Calculate the combined average:
Combined total points: 1,700 + 2,340 = 4,040 points
Combined number of students: 20 + 30 = 50 students
Combined average: 4,040 / 50 = 80.8
Compare to Quantity B:
80.8 < 81
Therefore, Quantity B is greater.
Answer: B
Alternative approach using weighted average reasoning:
The combined average must fall between 78 and 85. Since Class B (average 78) has 30 students and Class A (average 85) has 20 students, Class B is larger, so the combined average will be closer to 78 than to 85.
The exact position can be found using weights:
Combined average = (20/50) × 85 + (30/50) × 78
= 0.4 × 85 + 0.6 × 78
= 34 + 46.8
= 80.8
Since 80.8 < 81, Quantity B is greater.
Key insight: The combined average of groups is always the weighted average, not the simple average. Here, the simple average of 85 and 78 would be 81.5, but because Class B is larger, the combined average is pulled more strongly toward 78, resulting in 80.8. Understanding this principle allows quick estimation without full calculation.
Exam Strategy
When approaching comparing averages questions on the GRE, follow this systematic process:
Step 1: Identify the question type. Trigger phrases include "average," "mean," "arithmetic mean," "combined average," or scenarios describing groups with different characteristics. In Quantitative Comparison format, look for one or both quantities involving averages.
Step 2: Determine what information is given and what is unknown. List known values (sums, counts, individual values, averages) and identify unknowns. Assess whether you have sufficient information to make a definitive comparison.
Step 3: Consider whether calculation is necessary. Many average comparison questions can be solved through logical reasoning without computing exact values. Ask: "Can I determine the relationship without calculating both averages?" This saves time and reduces calculation errors.
Step 4: Check for special cases. Before committing to an answer, verify your reasoning holds for extreme cases. If comparing averages with an unknown variable, test what happens when that variable takes its minimum and maximum possible values.
Step 5: Watch for trap answer D. The GRE frequently includes "The relationship cannot be determined" as the correct answer. Don't assume you can always make a determination. Conversely, don't choose D prematurely—verify whether the given information truly is insufficient.
Trigger words and phrases to watch for:
- "Combined average" or "overall average" → signals weighted average situation
- "Positive integers" or other constraints → defines range of possible values
- "At least," "at most," "between" → establishes bounds rather than exact values
- "After adding/removing" → tests understanding of how changes affect averages
Time allocation: Allocate 1.5-2 minutes for average comparison questions. If you haven't made progress after 1 minute, use strategic guessing: eliminate obviously wrong answers, make an educated guess, and move forward. These questions reward strategic thinking over lengthy calculation.
Process of elimination tips:
- Eliminate answer A if you can construct a scenario where Quantity B is greater or equal
- Eliminate answer B if you can construct a scenario where Quantity A is greater or equal
- Eliminate answer C if you can construct scenarios where the quantities differ
- Choose answer D only after confirming that multiple different relationships are possible given the constraints
Memory Techniques
Mnemonic for effect of adding values: "ABOVE goes UP, BELOW goes DOWN"
- Adding a value ABOVE the current average pushes the average UP
- Adding a value BELOW the current average pulls the average DOWN
Visualization for combined averages: Picture a seesaw with the combined average as the balance point. The heavier side (larger group) pulls the balance point toward its average. The combined average is always between the two group averages, closer to the larger group.
Acronym for systematic comparison: SCREW
- Sums: Calculate or estimate total sums
- Counts: Identify number of values in each set
- Range: Determine possible value ranges
- Extremes: Test extreme cases
- Weighted: Remember combined averages are weighted by size
Memory aid for sufficiency: "Overlap means no hope" - If the ranges of possible averages overlap between two quantities, you cannot determine the relationship (answer D).
Formula memory: Remember that Average = Sum/Count can be rearranged to Sum = Average × Count. This form is often more useful for comparisons because it eliminates fractions.
Summary
Comparing averages on the GRE requires both computational facility and strategic reasoning. The fundamental principle—that average equals sum divided by count—enables multiple solution approaches, from direct calculation to logical inference. Success depends on understanding how adding or removing values affects averages (values above the average increase it, values below decrease it), recognizing that combined group averages are weighted by group sizes (the combined average falls between individual averages, closer to the larger group), and critically, identifying when sufficient information exists to make a definitive comparison versus when the relationship cannot be determined. The GRE tests these concepts through Quantitative Comparison questions that reward recognizing patterns, testing extreme cases, and avoiding common traps like assuming the simple average applies to combined groups or believing every comparison can be determined. Mastery requires practice identifying question types, applying systematic solution strategies, and developing intuition for when calculation can be avoided through logical reasoning about relationships between quantities.
Key Takeaways
- The average of combined groups is a weighted average, not a simple average, and always falls between the individual group averages, closer to the larger group's average
- Adding a value above the current average increases the average; adding a value below the current average decreases it, with the magnitude of change depending on set size
- When comparing averages, you can often avoid calculation by comparing (Sum_A × Count_B) versus (Sum_B × Count_A) or by reasoning about constraints and ranges
- Recognizing when information is insufficient to determine a relationship is a critical tested skill—if ranges of possible values overlap, choose answer D
- Test extreme cases and boundary values to verify your reasoning holds across all scenarios consistent with the given constraints
- The GRE favors questions where intuitive answers are wrong, particularly regarding combined averages and sufficiency
- Strategic reasoning about relationships often yields faster, more accurate solutions than exhaustive calculation
Related Topics
Weighted Averages: Extends comparing averages to scenarios where different values have different weights or importance, common in GRE word problems involving mixtures, rates, or combined work.
Median and Mode Comparisons: Alternative measures of central tendency that sometimes provide more robust comparisons than means, particularly with skewed distributions or outliers.
Standard Deviation and Spread: Measures how values vary around the average, enabling more sophisticated comparisons that account for consistency versus variability.
Ratio and Proportion Problems: Often involve comparing averages implicitly through part-to-whole relationships and scaling arguments.
Data Interpretation: Charts and graphs frequently require comparing averages across categories, time periods, or groups, applying these principles to visual data.
Mastering comparing averages provides the foundation for these advanced topics and strengthens overall quantitative reasoning ability, particularly the critical GRE skill of determining what can be concluded from given information.
Practice CTA
Now that you've mastered the core concepts and strategies for comparing averages, it's time to cement your understanding through practice. Attempt the practice questions designed specifically for this topic, focusing on applying the systematic approach outlined in the exam strategy section. Use the flashcards to reinforce high-yield facts and test your ability to quickly recall key principles under time pressure. Remember: the GRE rewards strategic thinking and pattern recognition as much as calculation ability. Each practice problem you solve builds the intuition needed to quickly identify question types and select optimal solution approaches on test day. You've built a strong foundation—now strengthen it through deliberate practice!
Sign up free to keep reading
Create a free AnvayaPrep account to finish this GRE guide on Comparing averages — plus flashcards and practice questions.