Overview
Ratios in data represent one of the most frequently tested quantitative concepts on the GRE, appearing in approximately 15-20% of all Quantitative Reasoning questions. This topic combines fundamental ratio understanding with data interpretation skills, requiring test-takers to extract numerical relationships from tables, charts, graphs, and word problems. Unlike simple ratio problems that present straightforward proportional relationships, GRE ratios in data questions embed these relationships within complex data sets, requiring multi-step reasoning and careful attention to what quantities are being compared.
Mastering ratios in data is essential because these questions test multiple skills simultaneously: reading comprehension of quantitative information, mathematical manipulation of proportions, and logical reasoning about relationships between different data categories. The GRE frequently uses ratios to obscure direct comparisons, forcing test-takers to convert between different representations of the same information. For instance, a question might provide raw numbers in a table but ask about percentage relationships, or present ratios but require absolute values in the answer.
This topic sits at the intersection of several core Quantitative Reasoning domains: it builds upon basic arithmetic and fraction manipulation, connects directly to percentages and proportions, and serves as a foundation for more advanced data interpretation questions involving rates, probability, and statistical reasoning. Understanding ratios in data contexts also strengthens skills needed for Data Interpretation sets, where multiple questions reference the same charts or tables, and for Quantitative Comparison questions that ask test-takers to evaluate relative magnitudes without calculating exact values.
Learning Objectives
- [ ] Identify when Ratios in data is being tested in GRE questions
- [ ] Explain the core rule or strategy behind Ratios in data
- [ ] Apply Ratios in data to GRE-style questions accurately
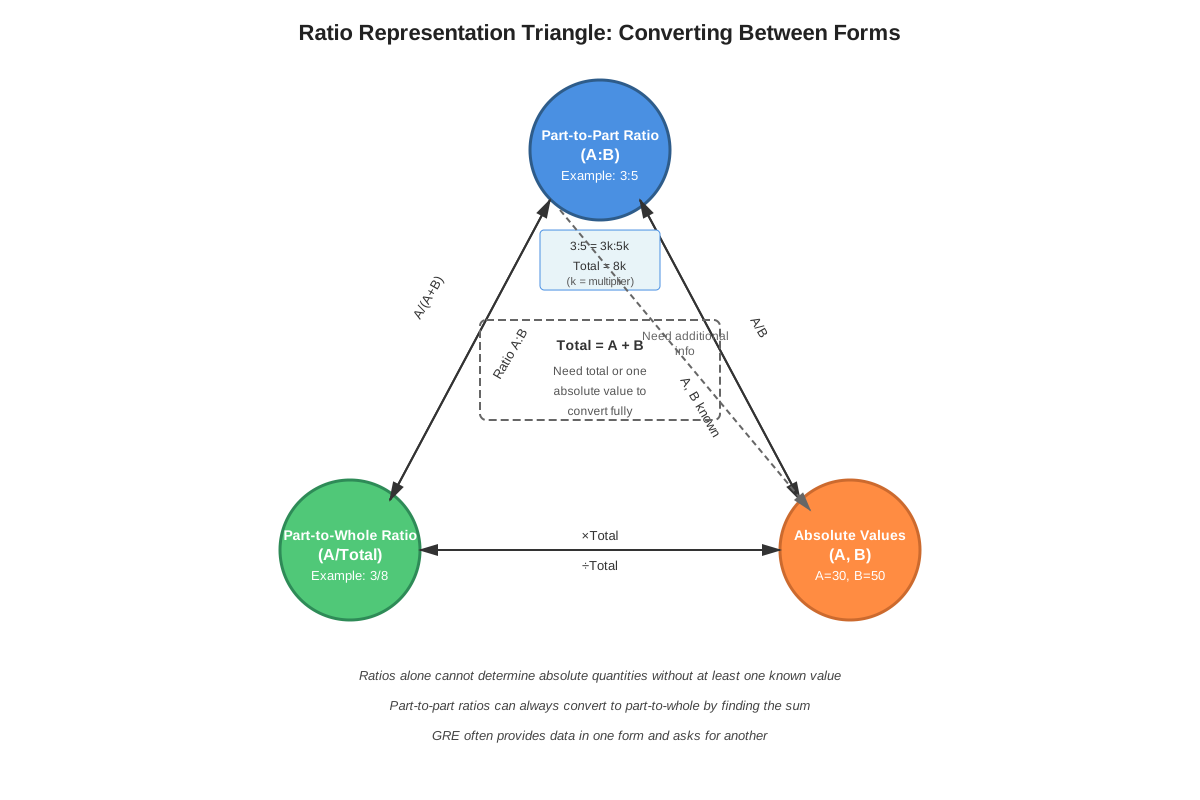
- [ ] Convert between different ratio representations (part-to-part, part-to-whole, and absolute values)
- [ ] Extract ratio information from tables, charts, and graphs efficiently
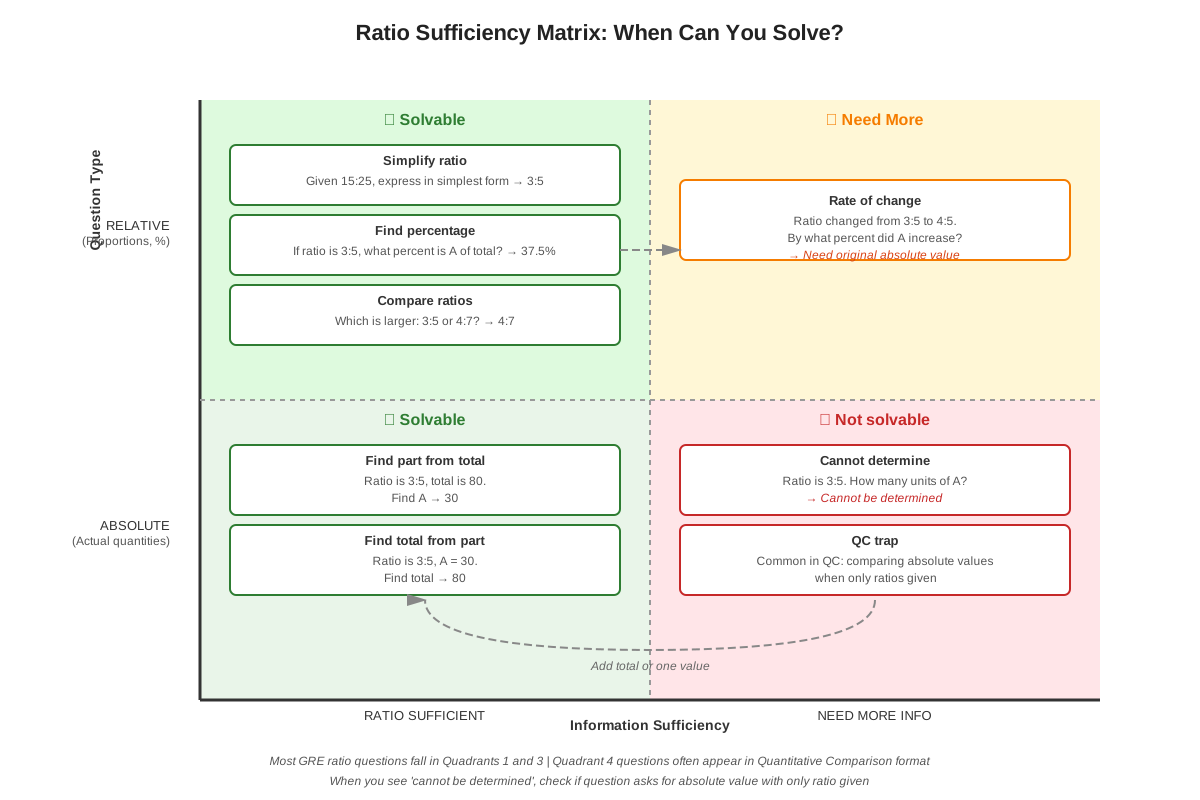
- [ ] Recognize when additional information is needed versus when ratio information alone is sufficient
- [ ] Solve multi-step problems that combine ratios with other data analysis concepts
Prerequisites
- Basic ratio and proportion concepts: Understanding how to set up and solve simple ratio equations (a:b = c:d) is fundamental to working with ratios embedded in data sets
- Fraction arithmetic: Ratios are often expressed as fractions, requiring fluency in addition, subtraction, multiplication, and division of fractional values
- Percentage calculations: Converting between ratios, fractions, and percentages is essential since data is frequently presented in mixed formats
- Table and graph reading: Basic familiarity with interpreting bar graphs, pie charts, line graphs, and data tables enables extraction of the numerical values needed for ratio calculations
- Algebraic manipulation: Setting up equations with variables and solving for unknowns is necessary when ratios provide relationships but not absolute quantities
Why This Topic Matters
In real-world applications, ratios in data contexts appear constantly in business analytics, scientific research, financial reporting, and policy analysis. Professionals regularly interpret market share ratios, demographic proportions, financial ratios (debt-to-equity, price-to-earnings), and efficiency metrics. The ability to quickly extract meaningful comparisons from complex data sets is a critical skill in graduate-level coursework across disciplines, from analyzing experimental results in sciences to evaluating economic indicators in social sciences.
On the GRE specifically, ratio questions appear in multiple formats: as standalone Problem Solving questions (approximately 8-12% of Quantitative Reasoning), within Data Interpretation sets (where 2-3 questions reference the same data display), and as Quantitative Comparison questions that test conceptual understanding of proportional relationships. The test makers favor ratio questions because they efficiently assess multiple competencies: numerical reasoning, attention to detail, and the ability to work with incomplete information.
Common exam presentations include: tables showing categorical data where students must calculate ratios between rows or columns; pie charts where angle measures or percentages must be converted to numerical ratios; bar graphs comparing multiple groups where relative relationships matter more than absolute values; and word problems describing scenarios with proportional relationships embedded in narrative form. The GRE particularly favors questions that require recognizing when ratio information is sufficient to answer a question without knowing actual quantities, testing conceptual understanding rather than just computational ability.
Core Concepts
Understanding Ratio Representations
A ratio expresses the quantitative relationship between two or more values, showing how many times one value contains another or how the values relate proportionally. In data contexts, ratios appear in three primary forms that test-takers must recognize and convert between fluently.
Part-to-part ratios compare distinct categories within a whole. For example, if a company employs 60 engineers and 40 salespeople, the ratio of engineers to salespeople is 60:40, which simplifies to 3:2. This representation tells us that for every 3 engineers, there are 2 salespeople, but doesn't directly reveal what fraction of total employees each group represents.
Part-to-whole ratios compare one category to the total of all categories. Using the same example with 60 engineers and 40 salespeople (100 total employees), the ratio of engineers to total employees is 60:100 or 3:5. This form directly converts to fractions and percentages: engineers represent 3/5 or 60% of all employees.
Absolute values versus ratio information represents a critical distinction on the GRE. A ratio of 3:2 could represent 3 and 2, or 30 and 20, or 300 and 200—any pair of numbers maintaining that proportional relationship. Many GRE questions test whether students understand that ratio information alone is insufficient to determine actual quantities without additional constraints.
Extracting Ratios from Data Displays
When working with ratios in data presented in tables, the key skill is identifying which values to compare. Tables typically organize information by categories (rows and columns), and ratio questions may ask about:
- Ratios within a single row (comparing different columns for one category)
- Ratios within a single column (comparing different rows for one variable)
- Ratios between totals (comparing row sums to column sums)
- Ratios across multiple cells (requiring addition before comparison)
For graph-based ratio questions, different display types require different extraction strategies:
| Graph Type | Ratio Extraction Strategy | Common Pitfall |
|---|---|---|
| Bar Graph | Compare bar heights directly; ratios equal the quotient of heights | Forgetting to check if axes start at zero |
| Pie Chart | Use percentages or angle measures; remember full circle = 360° or 100% | Confusing percentage points with ratios |
| Line Graph | Compare y-values at specific x-coordinates; may need to calculate differences | Using slopes when absolute values are needed |
| Scatter Plot | Compare coordinates of specific points; ratios may involve x-values, y-values, or both | Misidentifying which points to compare |
Ratio Scaling and Proportional Reasoning
A fundamental property of ratios is that they remain constant under scaling: if a:b = 3:2, then 3k:2k maintains the same ratio for any value k. This scaling principle enables several problem-solving strategies:
- Finding the multiplier: When given that a ratio is 3:2 and one actual value is 45, determine k by solving 3k = 45, yielding k = 15, so the other value is 2(15) = 30.
- Using ratio parts as units: Treat ratio components as "parts" of a whole. If a ratio is 3:2:5 (three quantities), the total is 3+2+5 = 10 parts. If the actual total is 200, each part equals 200/10 = 20, making the actual values 60, 40, and 100.
- Setting up proportions: Cross-multiplication solves for unknowns: if a/b = c/d, then ad = bc. This technique applies when one ratio is known and partial information about another equivalent ratio is given.
Compound Ratios and Chained Relationships
Compound ratios involve three or more quantities with multiple pairwise relationships. For example, if the ratio of A to B is 2:3 and the ratio of B to C is 4:5, finding the ratio of A to C requires finding a common expression for B.
The systematic approach:
- Write both ratios: A:B = 2:3 and B:C = 4:5
- Scale ratios so B has the same value in both: A:B = 8:12 and B:C = 12:15
- Combine: A:B:C = 8:12:15
- Extract the desired comparison: A:C = 8:15
This technique frequently appears in GRE questions involving multiple categories or time periods where relationships are given piecewise rather than directly.
Ratios with Constraints and Additional Information
Many GRE ratio questions provide the ratio relationship plus one additional piece of information that enables solving for actual values. Common constraint types include:
- Total value: "The ratio of x to y is 3:5, and x + y = 64"
- Difference: "The ratio of x to y is 7:4, and x - y = 18"
- One actual value: "The ratio of x to y is 2:9, and y = 45"
- Sum or product involving both: "The ratio of x to y is 3:4, and 2x + 3y = 85"
The solution strategy involves expressing both quantities in terms of the ratio parts (x = 3k, y = 5k for a 3:5 ratio), then substituting into the constraint equation to solve for k.
Ratio Changes and Dynamic Scenarios
Some challenging GRE questions describe situations where ratios change due to additions, removals, or other modifications. For example: "A container has red and blue marbles in a 3:2 ratio. After adding 10 red marbles, the ratio becomes 2:1. How many blue marbles are in the container?"
The systematic approach:
- Express initial state: R = 3k, B = 2k for some value k
- Express final state: R + 10 and B (unchanged)
- Set up equation using new ratio: (3k + 10)/(2k) = 2/1
- Solve: 3k + 10 = 4k, so k = 10
- Answer the question: B = 2k = 20 blue marbles
Concept Relationships
The concepts within ratios in data build hierarchically: understanding basic ratio representations (part-to-part vs. part-to-whole) forms the foundation for extracting ratios from data displays, which in turn enables solving more complex problems involving ratio scaling and proportional reasoning. Compound ratios extend the basic scaling principle to situations with multiple interconnected relationships, while ratio changes add a dynamic element requiring algebraic setup.
These concepts connect backward to prerequisite topics: fraction arithmetic provides the computational tools for ratio manipulation, while percentage knowledge enables conversion between different representations. Algebraic manipulation skills become essential when ratios provide relationships but require additional constraints to solve for actual values.
Looking forward, mastering ratios in data enables progression to more advanced topics: rates and unit conversions (which are specialized ratios), probability (often expressed as ratios of favorable to total outcomes), weighted averages (which combine ratios with arithmetic means), and statistical concepts like odds ratios and correlation coefficients.
The relationship map: Basic Ratio Concepts → Ratio Representations → Data Extraction Skills → Proportional Reasoning → Compound Ratios → Dynamic Ratio Problems → Advanced Data Analysis Topics
Quick check — test yourself on Ratios in data so far.
Try Flashcards →High-Yield Facts
⭐ A ratio alone does not determine actual quantities—the ratio 3:2 could represent 3 and 2, or 300 and 200, or any proportional pair
⭐ Part-to-part ratios convert to part-to-whole by adding components—if A:B = 3:2, then A represents 3/(3+2) = 3/5 of the total
⭐ Ratios remain constant under scaling—if a:b = 3:5, then 3k:5k maintains the same ratio for any multiplier k
⭐ To combine ratios with a common term, scale so that term has equal values—if A:B = 2:3 and B:C = 4:5, scale to A:B = 8:12 and B:C = 12:15
⭐ When a ratio and total are given, use ratio parts as units—if the ratio is 3:2:5 and total is 100, each part equals 100/10 = 10
- Ratios can be expressed as fractions, decimals, percentages, or colon notation—all are equivalent representations
- The order matters in ratio notation: "A to B" means A:B, not B:A
- Simplifying ratios by dividing by the greatest common factor makes calculations easier but doesn't change the relationship
- In pie charts, the ratio of any sector to the whole equals its angle measure divided by 360° or its percentage divided by 100%
- When ratios change due to additions or removals, set up equations for both the initial and final states
- Cross-multiplication (if a/b = c/d, then ad = bc) is the fastest way to solve proportion equations
- Ratio questions asking "what fraction" or "what percent" are requesting part-to-whole ratios
Common Misconceptions
Misconception: A ratio of 3:2 means there are exactly 3 of one item and 2 of another.
Correction: A ratio describes a proportional relationship, not absolute quantities. The ratio 3:2 means the first quantity is 3/2 times the second, but actual values could be 6 and 4, or 30 and 20, or any pair maintaining that proportion.
Misconception: If the ratio of A to B is 3:5, then A represents 3% and B represents 5%.
Correction: The ratio 3:5 means A is 3/(3+5) = 3/8 = 37.5% of the total, and B is 5/8 = 62.5% of the total. The ratio components don't directly equal percentages unless they sum to 100.
Misconception: Doubling both quantities in a ratio changes the ratio.
Correction: Scaling both quantities by the same factor preserves the ratio. If A:B = 3:2, then 2A:2B = 6:4 = 3:2 (simplified). Ratios are invariant under uniform scaling.
Misconception: To find the ratio of A to C when given A:B and B:C, simply multiply the ratios.
Correction: You must scale the ratios so the common term (B) has the same value in both expressions, then combine. If A:B = 2:3 and B:C = 4:5, scale to A:B:C = 8:12:15, giving A:C = 8:15, not 2×4:3×5.
Misconception: In a bar graph, if one bar is twice as tall as another, the ratio is 2:1 regardless of the axis.
Correction: If the y-axis doesn't start at zero, visual height doesn't represent the true ratio. Always read actual values from the axis labels. A bar from 50 to 100 and another from 50 to 75 appear in a 2:1 height ratio but represent values in a 100:75 = 4:3 ratio.
Misconception: When a ratio problem gives percentages, those percentages can be used directly as ratio components.
Correction: Percentages represent part-to-whole relationships, not part-to-part. If A is 60% and B is 40%, the ratio A:B is 60:40 = 3:2, but you must recognize these are percentages of the same whole. If they're percentages of different wholes, they cannot be directly compared.
Misconception: Adding the same amount to both parts of a ratio preserves the ratio.
Correction: Ratios are preserved only by multiplication, not addition. If A:B = 3:2, then (A+5):(B+5) ≠ 3:2. For example, 3:2 becomes 8:7 after adding 5 to each, which simplifies differently.
Worked Examples
Example 1: Multi-Step Ratio Problem with Data Table
Problem: A company's employee data shows the following distribution:
| Department | Male | Female |
|---|---|---|
| Engineering | 45 | 30 |
| Sales | 20 | 40 |
| Marketing | 15 | 25 |
What is the ratio of total male employees to total female employees, and what fraction of all employees are female engineers?
Solution:
Step 1: Calculate total male employees.
Male total = 45 + 20 + 15 = 80
Step 2: Calculate total female employees.
Female total = 30 + 40 + 25 = 95
Step 3: Express the ratio of male to female.
Male:Female = 80:95 = 16:19 (dividing both by 5)
Step 4: Calculate total employees.
Total = 80 + 95 = 175
Step 5: Find the fraction of female engineers.
Female engineers = 30
Fraction = 30/175 = 6/35
Answer: The ratio of male to female employees is 16:19, and female engineers represent 6/35 of all employees.
Connection to Learning Objectives: This problem demonstrates extracting ratio information from tabular data (requiring addition across rows), converting to simplified form, and distinguishing between part-to-part ratios (male to female) and part-to-whole ratios (female engineers to all employees).
Example 2: Compound Ratio with Constraints
Problem: In a school, the ratio of teachers to students is 1:15, and the ratio of students to administrative staff is 25:2. If there are 300 students, how many teachers and administrative staff members are there in total?
Solution:
Step 1: Use the student count to find teachers.
Teachers:Students = 1:15
Let T = number of teachers
T/300 = 1/15
T = 300/15 = 20 teachers
Step 2: Use the student count to find administrative staff.
Students:Admin = 25:2
Let A = number of admin staff
300/A = 25/2
Cross-multiply: 25A = 600
A = 24 administrative staff
Step 3: Calculate total.
Total = 20 + 24 = 44
Answer: There are 44 teachers and administrative staff members combined.
Connection to Learning Objectives: This problem illustrates using ratio information with one known absolute value to determine other quantities, working with compound ratios involving a common term (students), and applying proportional reasoning through cross-multiplication.
Example 3: Dynamic Ratio Change
Problem: A solution contains alcohol and water in a 2:5 ratio. After adding 15 liters of water, the ratio becomes 2:7. How many liters of alcohol are in the solution?
Solution:
Step 1: Express initial quantities using ratio parts.
Let alcohol = 2k and water = 5k for some value k
Step 2: Express the situation after adding water.
Alcohol remains 2k (unchanged)
Water becomes 5k + 15
Step 3: Set up equation using the new ratio.
The new ratio is 2:7, so:
2k/(5k + 15) = 2/7
Step 4: Cross-multiply and solve.
7(2k) = 2(5k + 15)
14k = 10k + 30
4k = 30
k = 7.5
Step 5: Find the amount of alcohol.
Alcohol = 2k = 2(7.5) = 15 liters
Answer: The solution contains 15 liters of alcohol.
Connection to Learning Objectives: This problem demonstrates handling dynamic scenarios where ratios change, setting up algebraic equations from ratio relationships, and using the scaling principle to express quantities in terms of a common multiplier.
Exam Strategy
Trigger Words: Watch for phrases like "ratio of," "for every," "per," "proportion of," "what fraction," and "what percent." These signal ratio relationships even when the word "ratio" doesn't appear explicitly.
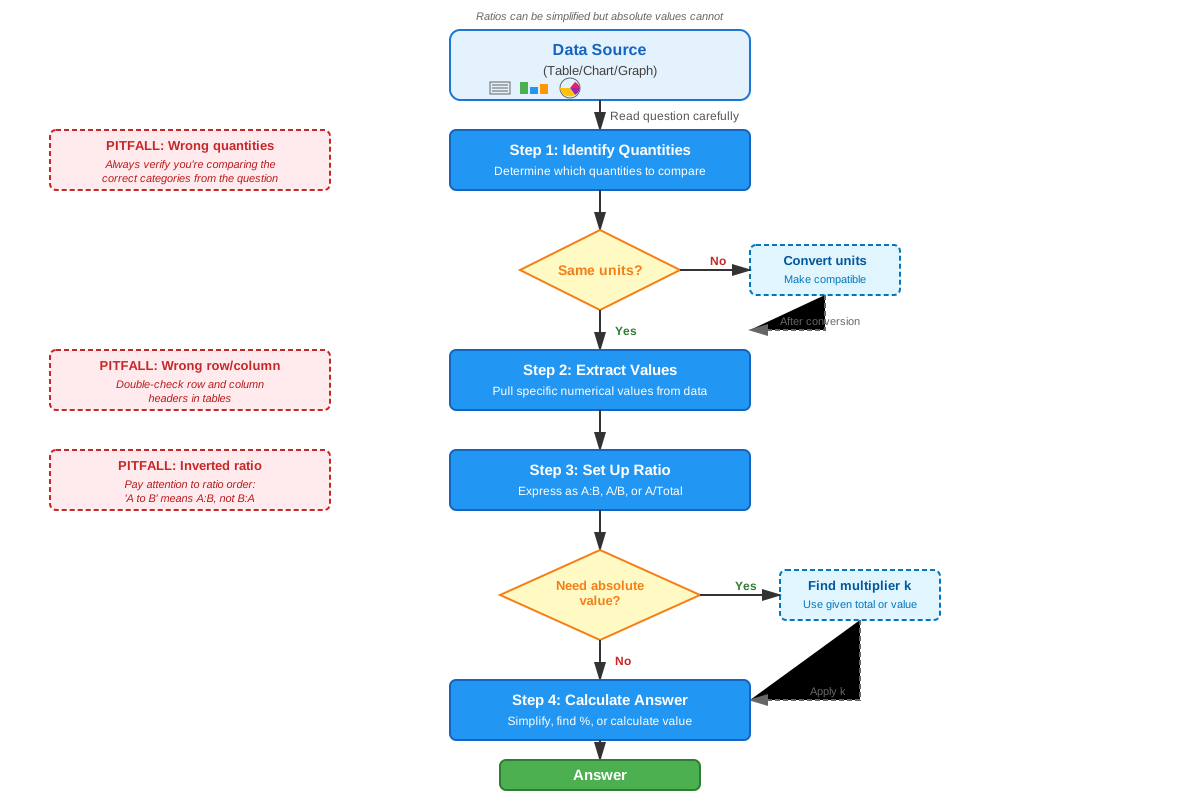
When approaching GRE ratio questions, follow this systematic process:
Step 1: Identify what's being compared. Determine whether the question asks for part-to-part or part-to-whole ratios. Underline or note the specific quantities mentioned.
Step 2: Extract or calculate the relevant values. If data is presented in tables or graphs, carefully read labels and units. Perform any necessary additions or subtractions before forming ratios.
Step 3: Determine if ratio information alone is sufficient. Many Quantitative Comparison questions test whether you recognize that ratios don't determine absolute values. If the question asks for an actual quantity (not a relative comparison), check whether additional constraints are provided.
Step 4: Set up the problem algebraically when needed. Use the ratio parts as variables (3k and 5k for a 3:5 ratio) and create equations from any additional information given.
Step 5: Simplify before calculating when possible. Reducing ratios to lowest terms early prevents working with unnecessarily large numbers. For example, 120:80 simplifies to 3:2 immediately.
Process of elimination tips specific to ratios:
- Eliminate answer choices that violate the given ratio relationship
- Check whether answer choices represent simplified or unsimplified ratios
- For "which of the following could be" questions, test whether each option maintains the required proportional relationship
- In Quantitative Comparison, if both quantities scale by the same factor, the relationship is preserved
Time allocation: Straightforward ratio extraction from data should take 30-45 seconds. Multi-step problems involving compound ratios or dynamic changes may require 90-120 seconds. If a problem requires more than 2 minutes, consider whether you're missing a simpler approach or should make an educated guess and move forward.
Common trap patterns: The GRE frequently presents answer choices that represent common errors—the unreduced ratio, the reciprocal ratio, part-to-part when part-to-whole is needed, or values that would be correct if the ratio were reversed. Always verify which quantities are in the numerator versus denominator.
Memory Techniques
Mnemonic for ratio types: "PPW" = Part-to-Part vs. Part-to-Whole. When you see a ratio, ask "PPW?" to determine which type you're working with.
Visualization for scaling: Picture a recipe. If a recipe calls for ingredients in a 2:3 ratio, doubling the recipe means 4:6 (still the same ratio). This concrete image reinforces that ratios are preserved under uniform scaling.
Acronym for compound ratios: "SCALE" = Set up both ratios, Choose the common term, Adjust to equal values, Link them together, Extract what's needed.
The "k-trick" reminder: Whenever you see a ratio, immediately think "times k." If the ratio is 3:5, write "3k and 5k" on your scratch paper. This automatic habit prevents the misconception that ratios represent actual values.
Percentage-ratio conversion: Remember "over the sum". To convert a part-to-part ratio to a percentage, put each part over the sum of all parts. For 3:2, that's 3/(3+2) = 60% and 2/(3+2) = 40%.
Dynamic ratio problems: Use the phrase "before and after" to organize your work. Create two columns on scratch paper labeled "Before" and "After," then write expressions for each quantity in both states.
Summary
Ratios in data represent proportional relationships between quantities, appearing throughout GRE Quantitative Reasoning in tables, graphs, word problems, and data interpretation sets. Success requires fluency in three key areas: recognizing different ratio representations (part-to-part, part-to-whole, and absolute values), extracting ratio information from various data displays, and applying proportional reasoning to solve multi-step problems. The fundamental principle is that ratios remain constant under scaling—if a:b = 3:5, then 3k:5k maintains that relationship for any multiplier k. This scaling property enables solving for actual values when ratios are combined with constraints like totals, differences, or one known quantity. Compound ratios require scaling to create common terms before combining, while dynamic ratio problems demand algebraic setup of before-and-after states. The critical distinction between ratio information (which describes relative relationships) and absolute values (which specify actual quantities) appears frequently in Quantitative Comparison questions. Mastering these concepts requires both computational accuracy and conceptual understanding of when ratio information alone is sufficient versus when additional data is needed.
Key Takeaways
- Ratios describe proportional relationships, not absolute quantities—the ratio 3:2 could represent many different pairs of actual values
- Convert between part-to-part and part-to-whole ratios by adding components: if A:B = 3:2, then A is 3/5 of the total
- Use the scaling principle (ratio parts as "k" multiples) to set up equations when ratios are combined with constraints
- Extract ratios carefully from data displays by identifying exactly which values to compare and performing necessary calculations first
- Combine compound ratios by scaling to create equal values for the common term before linking the relationships
- Recognize trigger words like "for every," "per," and "what fraction" that signal ratio relationships
- Distinguish between questions asking for relative comparisons (where ratios suffice) versus absolute values (where additional information is needed)
Related Topics
Percentages and Percent Change: Ratios and percentages are intimately connected, as percentages represent part-to-whole ratios expressed per hundred. Mastering ratio concepts enables quick conversion between these representations and solving complex percent change problems.
Rates and Unit Conversions: Rates are specialized ratios comparing quantities with different units (miles per hour, dollars per item). Understanding ratio scaling directly applies to unit conversion and rate problems.
Weighted Averages: These combine ratio concepts with arithmetic means, requiring proportional reasoning to determine how different groups contribute to overall averages based on their relative sizes.
Probability: Probability is fundamentally a ratio of favorable outcomes to total outcomes. Ratio fluency enables quick probability calculations and understanding of odds.
Data Interpretation Sets: Multi-question sets referencing the same charts or tables frequently require extracting and comparing ratios across different categories or time periods.
Practice CTA
Now that you've mastered the core concepts of ratios in data, it's time to solidify your understanding through active practice. Attempt the practice questions associated with this topic, focusing on identifying the type of ratio relationship being tested and applying the systematic strategies outlined above. Use the flashcards to reinforce high-yield facts and common trap patterns. Remember: ratio questions reward both computational accuracy and conceptual insight—practice recognizing when ratio information alone is sufficient versus when you need additional constraints. Each practice problem you solve strengthens your pattern recognition for test day. You've got this!
Sign up free to keep reading
Create a free AnvayaPrep account to finish this GRE guide on Ratios in data — plus flashcards and practice questions.