Overview
Comparing probabilities is a critical skill tested in the GRE Quantitative Reasoning section, particularly within Quantitative Comparison questions. This topic requires students to evaluate two probability scenarios and determine which is more likely, whether they are equal, or if the relationship cannot be determined from the given information. Unlike straightforward probability calculation questions, GRE comparing probabilities questions demand conceptual understanding, strategic thinking, and the ability to recognize patterns without always performing exhaustive calculations.
The GRE frequently tests probability comparison because it efficiently assesses multiple mathematical competencies simultaneously: understanding of basic probability principles, proportional reasoning, logical analysis, and the ability to work with abstract scenarios. Students who master this topic gain a significant advantage, as these questions appear regularly in both the Quantitative Comparison format and standard multiple-choice problems. The ability to quickly assess relative likelihoods without computing exact values is particularly valuable given the time constraints of the exam.
Within the broader Quantitative Reasoning framework, comparing probabilities bridges several mathematical domains. It connects foundational concepts like fractions, ratios, and proportions with more advanced topics including combinatorics, conditional probability, and statistical reasoning. This topic also reinforces critical thinking skills essential for data interpretation questions and real-world problem-solving scenarios that appear throughout the GRE.
Learning Objectives
- [ ] Identify when Comparing probabilities is being tested
- [ ] Explain the core rule or strategy behind Comparing probabilities
- [ ] Apply Comparing probabilities to GRE-style questions accurately
- [ ] Distinguish between scenarios requiring calculation versus conceptual comparison
- [ ] Recognize common probability comparison patterns and shortcuts
- [ ] Evaluate whether sufficient information exists to make a definitive comparison
- [ ] Apply complementary probability principles to simplify comparisons
Prerequisites
- Basic probability concepts: Understanding that probability ranges from 0 to 1 and represents the likelihood of an event occurring; essential for evaluating any probability scenario
- Fractions and ratios: Ability to compare fractions and convert between fractions, decimals, and percentages; necessary for comparing probability values
- Set theory fundamentals: Knowledge of unions, intersections, and complements; required for understanding compound probability events
- Combinatorics basics: Familiarity with counting principles and simple permutations/combinations; helps in determining total possible outcomes
- Quantitative Comparison format: Understanding of the four answer choices (A, B, C, D) and when each applies; critical for answering these question types correctly
Why This Topic Matters
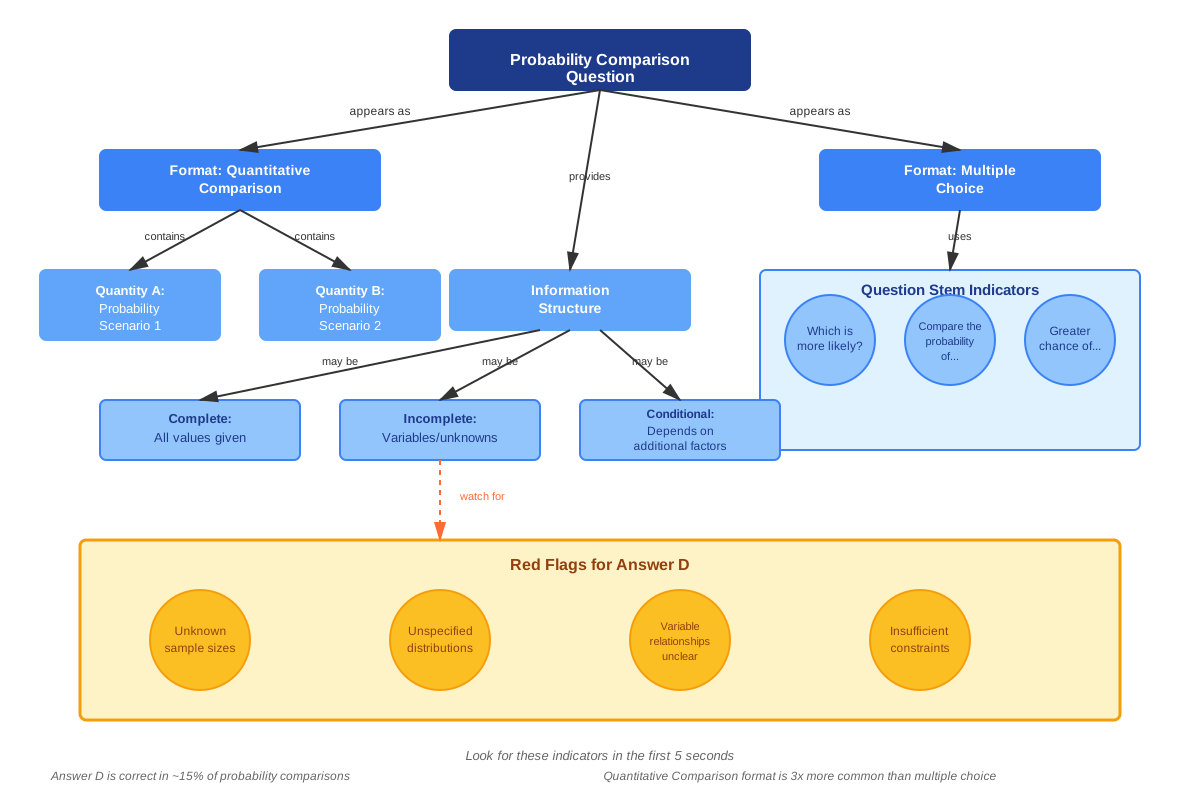
Probability comparison questions appear in approximately 10-15% of GRE Quantitative Reasoning sections, making them a high-yield topic for test preparation. These questions typically manifest in three formats: Quantitative Comparison questions (most common), multiple-choice questions asking which scenario is most likely, and data interpretation questions requiring probability analysis. The GRE favors probability comparisons because they test mathematical reasoning rather than mere computational ability.
In real-world applications, comparing probabilities underlies critical decision-making in fields ranging from medicine (comparing treatment success rates) to finance (evaluating investment risks) to public policy (assessing intervention effectiveness). The ability to quickly determine which of two scenarios is more likely without extensive calculation is a practical skill that extends far beyond standardized testing.
On the GRE specifically, probability comparison questions often appear as "trap questions" designed to catch students who rush into calculations without thinking strategically. Test-makers deliberately construct scenarios where intuitive comparison methods are faster and more reliable than formal computation. Students who recognize these patterns can save valuable time while improving accuracy. Common exam presentations include comparing draws from different urns, comparing probabilities of independent versus dependent events, and comparing complementary probabilities.
Core Concepts
Fundamental Probability Comparison Principles
When comparing probabilities, the core objective is determining the relative likelihood of two events without necessarily calculating exact probability values. The fundamental principle states that for two events A and B, we need to determine whether P(A) > P(B), P(A) < P(B), P(A) = P(B), or whether the relationship cannot be determined.
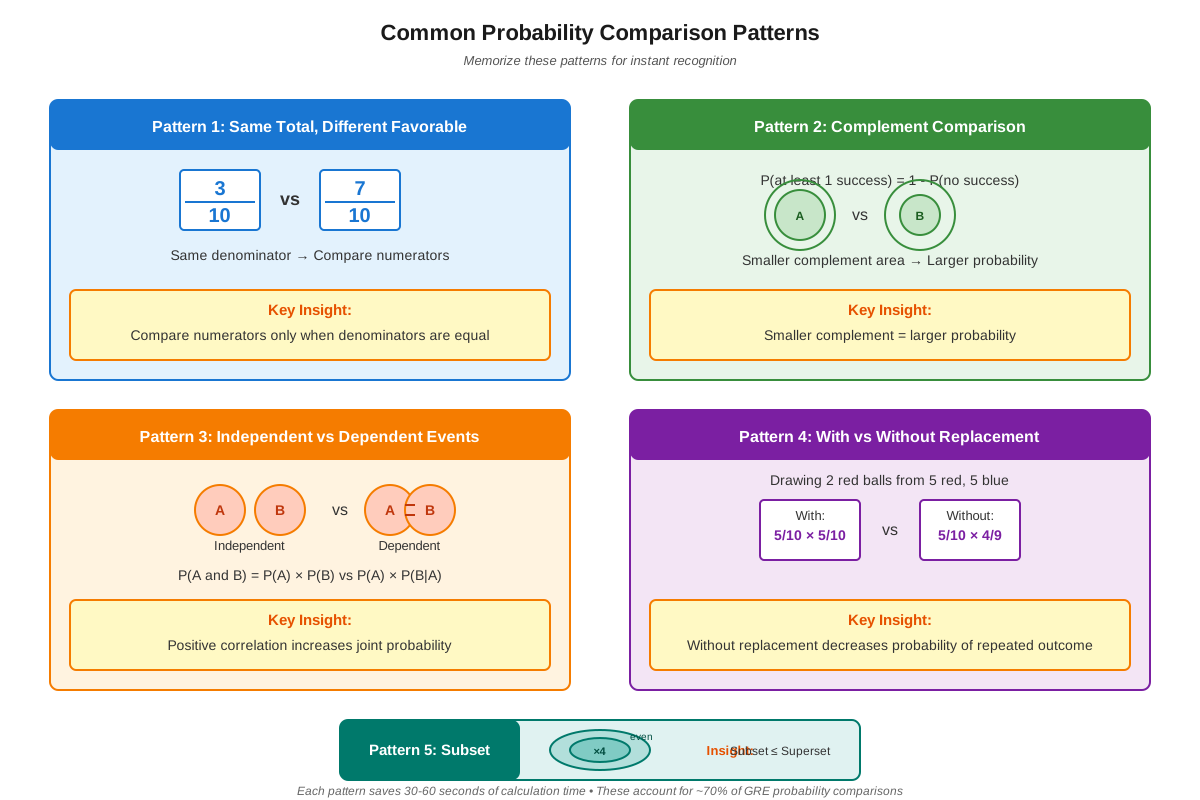
The basic probability formula P(Event) = (Favorable Outcomes)/(Total Possible Outcomes) provides the foundation. When comparing two probabilities, we can often compare numerators and denominators separately rather than computing complete fractions. If two probabilities share the same denominator, the comparison reduces to comparing numerators. Conversely, if numerators are equal, the probability with the smaller denominator is larger.
Strategic Comparison Without Full Calculation
A key strategy for GRE success involves recognizing when full calculation is unnecessary. Consider comparing the probability of drawing a red marble from Urn A (3 red, 7 blue) versus Urn B (4 red, 10 blue). Rather than calculating 3/10 versus 4/14, recognize that 3/10 = 0.30 while 4/14 ≈ 0.286, but more efficiently: cross-multiply to compare 3×14 versus 4×10, yielding 42 versus 40, confirming Urn A has higher probability.
The cross-multiplication technique works universally for comparing fractions: to compare a/b versus c/d, compare a×d versus b×c. This method is particularly valuable when dealing with probabilities expressed as fractions with different denominators.
Independent versus Dependent Events
Understanding how event relationships affect probability comparisons is crucial. For independent events, the probability of both occurring equals the product of individual probabilities: P(A and B) = P(A) × P(B). For dependent events, the second probability depends on the first outcome: P(A and B) = P(A) × P(B|A).
When comparing scenarios involving multiple events, independence versus dependence dramatically affects outcomes. Drawing with replacement creates independent events (probability remains constant), while drawing without replacement creates dependent events (probability changes after each draw). Generally, dependent events where early outcomes affect later probabilities create more complex comparisons requiring careful analysis.
Complementary Probability Comparisons
The complement rule states that P(not A) = 1 - P(A). This principle enables powerful comparison shortcuts. When comparing the probability of "at least one success" across scenarios, it's often easier to compare the probabilities of "no successes" and then reverse the inequality.
For example, comparing the probability of getting at least one head in three coin flips versus at least one six in three die rolls becomes simpler by comparing P(no heads) = (1/2)³ = 1/8 versus P(no sixes) = (5/6)³ = 125/216. Since 1/8 < 125/216, the complement probabilities reverse: P(at least one head) > P(at least one six).
Sample Space Analysis
Careful sample space analysis prevents common errors. The sample space represents all possible outcomes, and its size determines the denominator in probability calculations. When comparing probabilities, ensure both scenarios use correctly identified sample spaces.
Consider comparing: (A) probability of rolling a sum of 7 with two dice versus (B) probability of rolling a sum of 6 with two dice. The sample space for both is 36 possible outcomes. Sum of 7 occurs in 6 ways: (1,6), (2,5), (3,4), (4,3), (5,2), (6,1), giving probability 6/36 = 1/6. Sum of 6 occurs in 5 ways: (1,5), (2,4), (3,3), (4,2), (5,1), giving probability 5/36. Therefore, rolling a 7 is more likely.
Conditional Probability in Comparisons
Conditional probability P(A|B) represents the probability of A occurring given that B has occurred. When comparing conditional probabilities, the conditioning event restricts the sample space, which must be accounted for in comparisons.
Comparing P(A|B) versus P(A) reveals whether events are independent (equal probabilities) or dependent (unequal probabilities). When comparing two conditional probabilities P(A|B) versus P(A|C), both the numerators (favorable outcomes) and denominators (restricted sample spaces) may differ, requiring careful analysis.
Ratio and Proportion Methods
When probabilities are expressed as ratios, comparison becomes a matter of proportional reasoning. If Event A occurs with ratio 2:5 (2 favorable out of 7 total) and Event B with ratio 3:8 (3 favorable out of 11 total), compare 2/7 versus 3/11 using cross-multiplication: 2×11 = 22 versus 3×7 = 21, showing Event A is slightly more likely.
This approach extends to comparing odds, which express the ratio of favorable to unfavorable outcomes rather than favorable to total outcomes. Converting between probability and odds enables flexible comparison strategies.
Concept Relationships
The concepts within comparing probabilities form an interconnected framework. Fundamental probability principles serve as the foundation, from which strategic comparison techniques emerge as efficient alternatives to full calculation. These techniques include cross-multiplication for fraction comparison and complement analysis for complex scenarios.
Sample space analysis connects directly to the fundamental probability formula, ensuring accurate denominators in comparisons. This analysis becomes more sophisticated when dealing with conditional probability, where the sample space is restricted by given information. Independent versus dependent events determines whether probabilities multiply directly or require adjustment, fundamentally affecting comparison outcomes.
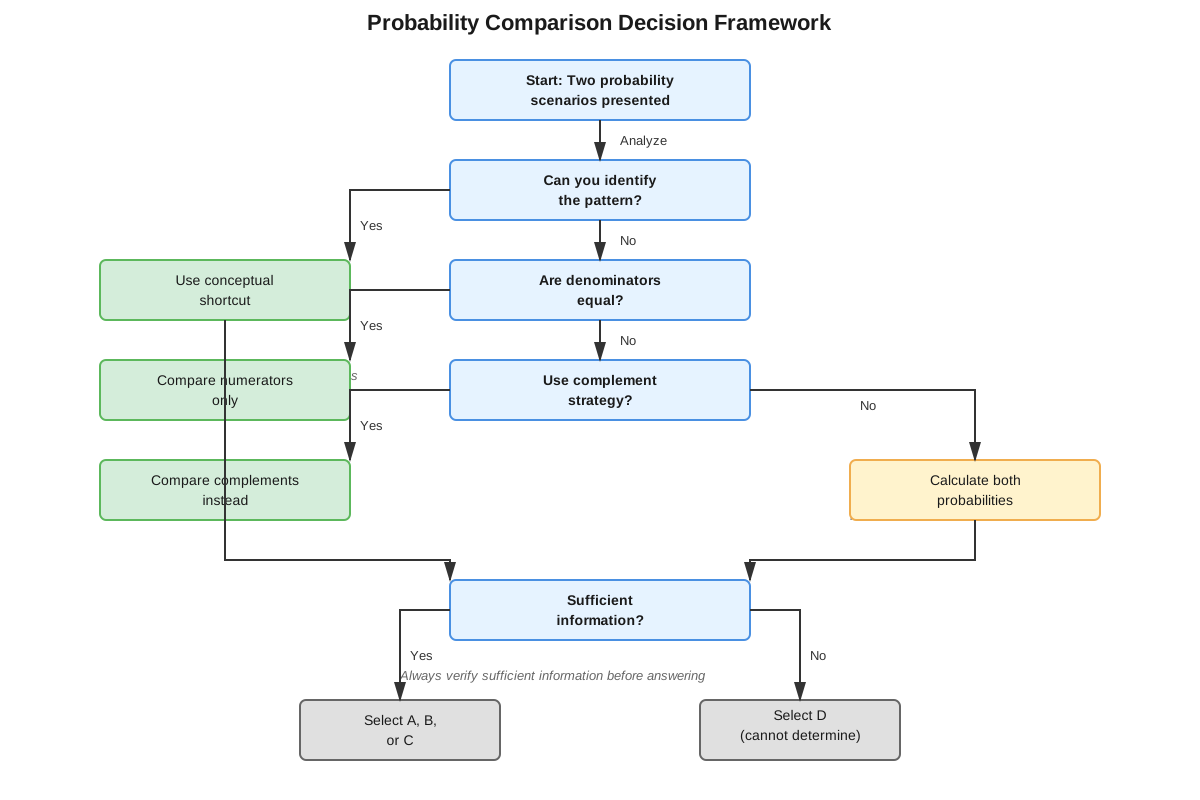
The relationship map flows as follows: Basic Probability Formula → Sample Space Identification → Event Type Classification (Independent/Dependent) → Comparison Strategy Selection (Direct Calculation/Cross-Multiplication/Complement Method) → Final Comparison Determination.
These concepts connect to prerequisite topics through fractions and ratios (enabling probability comparison), set theory (defining sample spaces and event relationships), and combinatorics (counting favorable and total outcomes). Related topics include expected value comparisons, statistical inference, and data interpretation—all requiring probability comparison as a foundational skill.
Quick check — test yourself on Comparing probabilities so far.
Try Flashcards →High-Yield Facts
⭐ When comparing probabilities with the same denominator, simply compare numerators; the larger numerator indicates higher probability
⭐ To compare fractions a/b and c/d without calculating decimals, use cross-multiplication: if a×d > b×c, then a/b > c/d
⭐ The complement rule P(not A) = 1 - P(A) often simplifies "at least one" probability comparisons
⭐ Independent events multiply probabilities: P(A and B) = P(A) × P(B); dependent events require conditional probability
⭐ Drawing without replacement creates dependent events with changing probabilities; drawing with replacement maintains constant probabilities
- Probabilities always range from 0 to 1 (or 0% to 100%); any calculation yielding values outside this range indicates an error
- When comparing P(A or B) for mutually exclusive events, simply compare P(A) + P(B) across scenarios
- Conditional probability P(A|B) = P(A and B)/P(B) restricts the sample space to cases where B occurs
- For equally likely outcomes, the event with more favorable outcomes has higher probability
- Multiplying probabilities (for "and" scenarios) always yields a result smaller than or equal to the smallest individual probability
Common Misconceptions
Misconception: Larger numbers in a probability scenario always indicate higher probability → Correction: Probability depends on the ratio of favorable to total outcomes, not absolute numbers. An urn with 10 red and 90 blue marbles (10/100 = 0.10) has lower probability of drawing red than an urn with 2 red and 3 blue marbles (2/5 = 0.40).
Misconception: Independent events are always more likely than dependent events → Correction: Independence versus dependence describes the relationship between events, not their likelihood. Whether independent or dependent events are more likely depends entirely on the specific probabilities involved.
Misconception: "At least one" probabilities can be calculated by simply adding individual probabilities → Correction: For "at least one" scenarios with multiple trials, use the complement rule: P(at least one success) = 1 - P(no successes). Direct addition leads to incorrect results, especially when individual probabilities are high.
Misconception: When comparing probabilities, both must be calculated exactly to determine which is larger → Correction: Strategic comparison techniques (cross-multiplication, complement analysis, ratio comparison) often determine relative magnitude without computing exact decimal values, saving time and reducing calculation errors.
Misconception: Conditional probability P(A|B) equals P(B|A) → Correction: These are generally different values. P(A|B) restricts the sample space to cases where B occurs, while P(B|A) restricts to cases where A occurs. They're equal only in special symmetric situations.
Misconception: If Event A is more likely than Event B, then "not A" is less likely than "not B" → Correction: The complement relationship reverses inequalities: if P(A) > P(B), then P(not A) < P(not B), since complements sum to 1.
Worked Examples
Example 1: Comparing Drawing Probabilities
Problem:
- Quantity A: The probability of drawing a red marble from a bag containing 5 red, 7 blue, and 3 green marbles
- Quantity B: The probability of drawing a blue marble from a bag containing 6 blue, 8 red, and 4 yellow marbles
Solution:
First, identify what's being compared: two single-draw probabilities from different bags.
For Quantity A:
- Favorable outcomes (red marbles): 5
- Total outcomes (all marbles): 5 + 7 + 3 = 15
- P(red from Bag A) = 5/15 = 1/3
For Quantity B:
- Favorable outcomes (blue marbles): 6
- Total outcomes (all marbles): 6 + 8 + 4 = 18
- P(blue from Bag B) = 6/18 = 1/3
Both probabilities equal 1/3, so the quantities are equal.
Answer: C (The two quantities are equal)
Key Insight: This problem demonstrates that different absolute numbers can yield identical probabilities. Simplifying fractions before comparing prevents unnecessary decimal calculations.
Example 2: Comparing Compound Event Probabilities
Problem:
- Quantity A: The probability of flipping a fair coin three times and getting at least one head
- Quantity B: The probability of rolling a fair six-sided die twice and getting at least one even number
Solution:
Both quantities involve "at least one" scenarios—perfect for the complement rule.
For Quantity A:
- P(at least one head) = 1 - P(no heads)
- P(no heads) = P(all tails) = (1/2)³ = 1/8
- P(at least one head) = 1 - 1/8 = 7/8
For Quantity B:
- P(at least one even) = 1 - P(no evens)
- P(no evens) = P(all odds) = (1/2)² = 1/4
- P(at least one even) = 1 - 1/4 = 3/4
Comparing 7/8 versus 3/4:
- Convert to common denominator: 7/8 versus 6/8
- 7/8 > 6/8
Answer: A (Quantity A is greater)
Key Insight: The complement rule simplified both calculations. Direct calculation would require considering multiple cases (exactly one success, exactly two successes, etc.), which is more time-consuming and error-prone. This example also illustrates that more trials (three coin flips versus two die rolls) with the same individual probability (1/2 for heads, 1/2 for even) yields higher probability of "at least one" success.
Exam Strategy
When approaching GRE probability comparison questions, begin by identifying the question type. Trigger phrases include "more likely," "greater probability," "which scenario," and in Quantitative Comparison format, two probability scenarios presented as Quantity A and Quantity B.
Step-by-step approach:
- Identify the events being compared: Clearly define what constitutes success in each scenario
- Determine event relationships: Are events independent or dependent? Is replacement involved?
- Assess calculation necessity: Can you compare without computing exact values?
- Choose comparison strategy: Cross-multiplication, complement rule, or direct calculation
- Verify reasonableness: Do results fall between 0 and 1? Does the comparison make intuitive sense?
Process-of-elimination tips: In Quantitative Comparison questions, eliminate answer choice D (cannot be determined) if all necessary information is provided and the problem involves concrete numbers rather than variables. Eliminate choice C (quantities are equal) if the scenarios have obviously different structures unless you've verified equality through calculation.
Time allocation: Spend 15-20 seconds identifying the comparison strategy before calculating. If a calculation approach seems lengthy, pause and consider whether a shortcut exists. Probability comparison questions should typically take 60-90 seconds; if you're exceeding two minutes, you may be over-calculating.
Watch for trap answers: GRE test-makers often construct scenarios where intuitive but incorrect reasoning leads to wrong answers. For example, they might present a scenario where more total items suggests higher probability, but the actual ratio is lower. Always verify your intuition with at least a quick ratio check.
Exam Tip: When you see "at least one" in a probability comparison, immediately consider the complement rule. This single strategy can save 30-45 seconds per question.
Memory Techniques
CROSS mnemonic for fraction comparison:
- Compare probabilities
- Remember: multiply across
- Opposite corners
- Size determined by products
- Skip decimal conversion
"Complement for Complex": When you see "at least one," "at least two," or "one or more," think complement. The phrase "at least" triggers complement rule consideration.
Visualization strategy: Picture probability as a filled portion of a container. When comparing two probabilities, visualize two identical containers with different fill levels. The fuller container represents higher probability. This mental image helps with intuitive checking of calculated results.
Independence check: Remember "WITH = Independent" (drawing WITH replacement creates independent events) and "WITHOUT = Dependent" (drawing WITHOUT replacement creates dependent events).
The 1-Rule: For any probability P, its complement is 1-P. Visualize a number line from 0 to 1; if P is at position 0.3, then 1-P is at position 0.7. When comparing probabilities, if P(A) > P(B), then their complements reverse: P(not A) < P(not B).
Summary
Comparing probabilities on the GRE requires strategic thinking rather than exhaustive calculation. The fundamental approach involves identifying whether events are independent or dependent, determining appropriate sample spaces, and selecting efficient comparison methods. Cross-multiplication enables quick fraction comparison without decimal conversion, while the complement rule simplifies "at least one" scenarios by focusing on the probability of no successes. Understanding that probability comparisons often don't require exact values—only relative magnitude—saves valuable time. Success depends on recognizing patterns, applying shortcuts appropriately, and verifying that results make logical sense within the 0-to-1 probability range. Master these core strategies, practice identifying trigger phrases, and develop intuition for when calculation can be avoided entirely.
Key Takeaways
- Comparing probabilities focuses on relative likelihood, not necessarily exact values
- Cross-multiplication (comparing a×d versus b×c for fractions a/b and c/d) enables efficient comparison without decimal calculation
- The complement rule P(not A) = 1 - P(A) simplifies "at least one" probability comparisons
- Independent events (with replacement) maintain constant probabilities; dependent events (without replacement) have changing probabilities
- Strategic comparison techniques save time and reduce calculation errors on the GRE
- Always verify that probability values fall between 0 and 1 as a reasonableness check
- Sample space analysis ensures accurate denominators in probability calculations
Related Topics
Expected Value Comparisons: Building on probability comparison, expected value incorporates both probability and outcome magnitude, enabling comparison of scenarios with different payoffs. Mastering probability comparison provides the foundation for understanding which scenarios yield higher average returns.
Conditional Probability and Bayes' Theorem: Advanced probability topics that extend comparison skills to scenarios where prior information affects likelihood. Understanding basic probability comparison is essential before tackling these more complex conditional relationships.
Combinatorics and Counting: Determining the number of favorable and total outcomes requires counting techniques. Strengthening combinatorics skills enhances ability to identify sample spaces accurately, improving probability comparison accuracy.
Data Interpretation with Probability: GRE data interpretation questions often require comparing probabilities derived from tables, graphs, or charts. The comparison strategies learned here apply directly to these more complex, multi-step problems.
Statistical Inference: Comparing probabilities underlies hypothesis testing and confidence interval interpretation. This foundational skill extends to graduate-level quantitative reasoning in research contexts.
Practice CTA
Now that you've mastered the core concepts and strategies for comparing probabilities, it's time to reinforce your learning through active practice. Attempt the practice questions designed specifically for this topic, focusing on applying the strategic comparison techniques rather than defaulting to full calculation. Use the flashcards to drill high-yield facts and common patterns until recognition becomes automatic. Remember: the GRE rewards strategic thinking and pattern recognition as much as computational skill. Each practice problem you solve strengthens your intuition and speeds your response time. You've built the foundation—now build the confidence through deliberate practice!
Sign up free to keep reading
Create a free AnvayaPrep account to finish this GRE guide on Comparing probabilities — plus flashcards and practice questions.