Overview
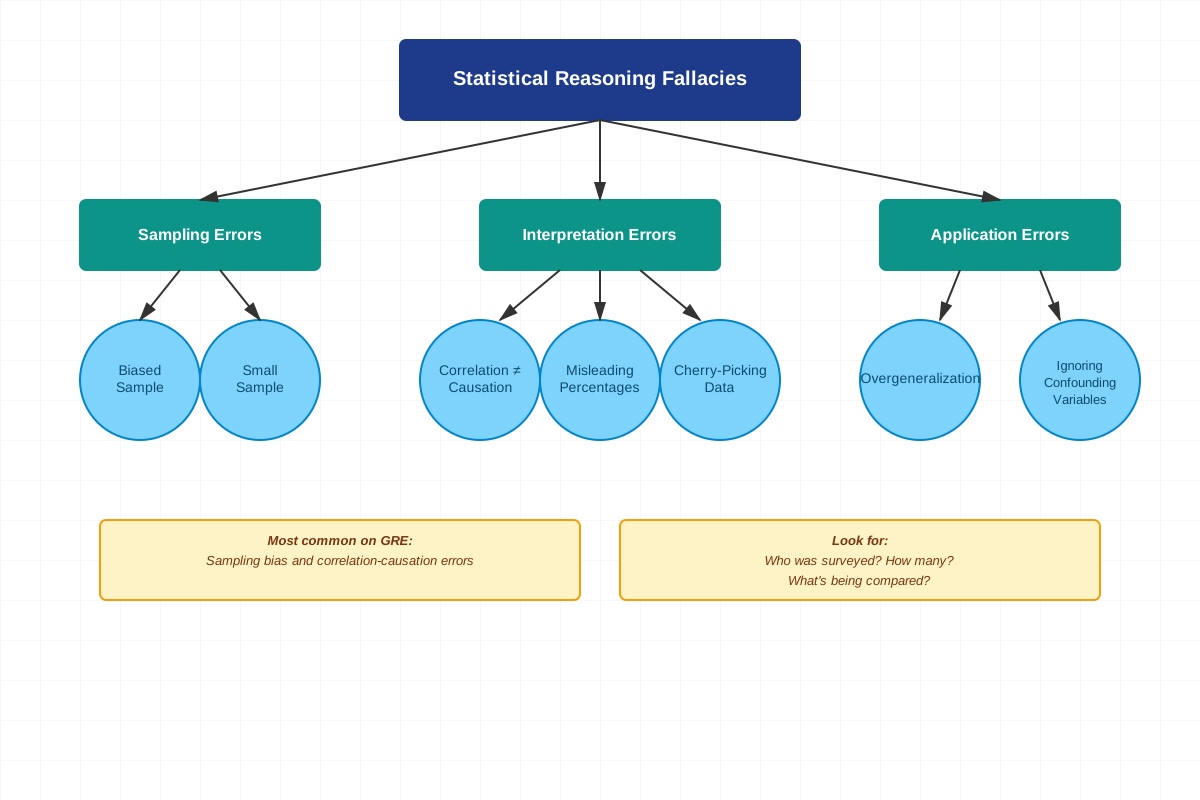
Statistical reasoning is a critical component of the GRE Verbal Reasoning section that tests the ability to evaluate arguments based on numerical data, surveys, studies, and statistical claims. While many test-takers associate statistics exclusively with the Quantitative section, GRE statistical reasoning appears frequently in Reading Comprehension passages and Argument Analysis questions, where students must assess the logical validity of conclusions drawn from data rather than perform calculations. This topic bridges quantitative literacy with critical thinking, requiring test-takers to identify flawed sampling methods, recognize correlation-causation errors, evaluate the representativeness of data, and determine whether statistical evidence actually supports the conclusions being drawn.
Mastering statistical reasoning is essential for the GRE because approximately 15-20% of Verbal Reasoning questions involve evaluating arguments that rely on statistical evidence, surveys, or numerical claims. These questions appear across multiple question types, including Reading Comprehension (especially inference and author's purpose questions), Critical Reasoning (strengthen/weaken questions), and Analytical Writing (Analyze an Argument essays). Students who can quickly identify statistical flaws gain a significant advantage, as these patterns repeat predictably across test forms.
Statistical reasoning connects intimately with broader Critical Reasoning skills, particularly argument structure analysis, assumption identification, and evidence evaluation. While other critical reasoning topics focus on logical fallacies or causal reasoning, statistical reasoning specifically addresses how numerical evidence functions within arguments. Understanding this topic enhances performance on questions involving scientific studies, business projections, demographic claims, and policy recommendations—all common GRE passage themes. The ability to scrutinize statistical claims also supports success in the Analytical Writing section, where identifying methodological flaws in data-based arguments is frequently required.
Learning Objectives
- [ ] Identify when Statistical reasoning is being tested
- [ ] Explain the core rule or strategy behind Statistical reasoning
- [ ] Apply Statistical reasoning to GRE-style questions accurately
- [ ] Distinguish between correlation and causation in argument contexts
- [ ] Evaluate the representativeness and adequacy of sample sizes
- [ ] Recognize common statistical fallacies including sampling bias, hasty generalization, and misleading statistics
- [ ] Assess whether statistical evidence is relevant to the conclusion being drawn
Prerequisites
- Basic argument structure: Understanding premises, conclusions, and assumptions is necessary because statistical reasoning questions require identifying how numerical evidence functions within an argument's logical framework.
- Fundamental mathematical literacy: Familiarity with percentages, ratios, and basic statistical terms (mean, median, sample) enables comprehension of the data being discussed, though calculations are rarely required.
- Critical thinking fundamentals: The ability to question claims and identify gaps in reasoning provides the foundation for spotting statistical manipulation and methodological flaws.
Why This Topic Matters
Statistical reasoning skills extend far beyond standardized testing into professional and academic contexts. Graduate programs across disciplines—from social sciences to business to public health—require students to evaluate research studies, interpret data-driven arguments, and make evidence-based decisions. In professional settings, the ability to critically assess statistical claims protects against manipulation by misleading advertisements, biased reports, and flawed policy proposals. This skill set represents essential quantitative literacy for informed citizenship and professional competence.
On the GRE specifically, statistical reasoning appears in approximately 3-5 questions per Verbal section, making it a high-yield topic relative to study time investment. These questions typically appear as:
- Reading Comprehension inference questions asking what can be concluded from study results
- Critical Reasoning strengthen/weaken questions involving surveys or statistical evidence
- Argument Analysis prompts requiring identification of methodological flaws in data collection or interpretation
- Reading Comprehension author's purpose questions examining how authors use statistical evidence
The GRE frequently embeds statistical reasoning in passages about social science research, business trends, environmental studies, and public health initiatives. Recognizing the patterns in how the test presents flawed statistical arguments allows for rapid, confident elimination of incorrect answer choices.
Core Concepts
Sample Representativeness and Bias
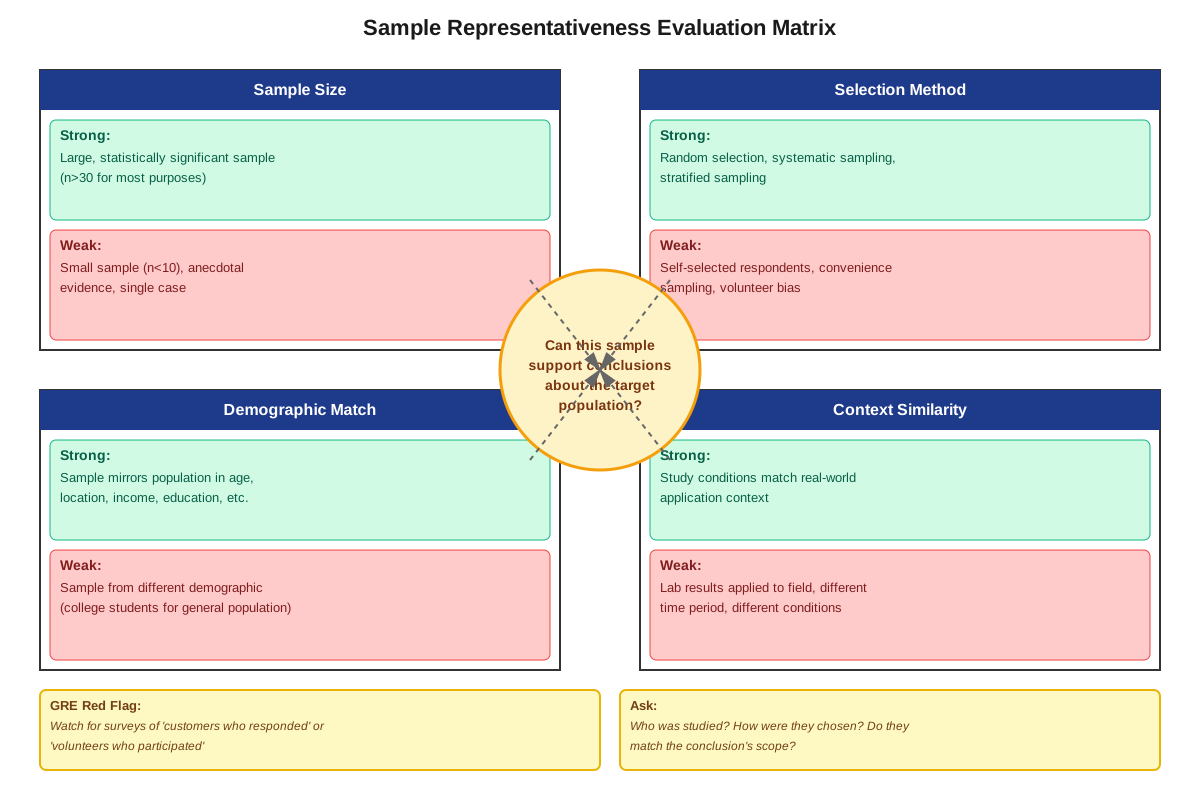
Sample representativeness refers to whether a subset of a population accurately reflects the characteristics of the entire population. The GRE frequently tests whether conclusions drawn from a sample can legitimately be generalized to a broader group. A representative sample must be sufficiently large, randomly selected, and free from systematic bias.
Sampling bias occurs when the method of selecting participants systematically excludes or overrepresents certain groups, making the sample unrepresentative. Common forms include:
- Self-selection bias: When participants volunteer, they may differ systematically from non-volunteers (e.g., only highly motivated customers complete satisfaction surveys)
- Convenience sampling: Selecting easily accessible participants rather than random selection (e.g., surveying only students at one university to draw conclusions about all college students)
- Non-response bias: When certain groups are less likely to respond, skewing results (e.g., phone surveys missing people who don't answer unknown numbers)
The GRE tests this concept by presenting arguments that generalize from biased samples. For example, an argument might conclude that "most residents support a policy" based on a survey of people who attended a town hall meeting—a self-selected group likely to have stronger opinions than the general population.
Sample Size Adequacy
Sample size refers to the number of observations or participants in a study. While larger samples generally provide more reliable results, the GRE focuses on whether the sample is adequate for the conclusion being drawn. A sample might be too small to:
- Detect meaningful differences between groups
- Represent diversity within a population
- Support confident generalizations
- Account for random variation
The test often presents arguments that draw sweeping conclusions from absurdly small samples (e.g., "Three customers preferred Product A, therefore it will dominate the market"). Conversely, some arguments fail because they ignore that even large samples can be biased if not properly selected.
Correlation vs. Causation
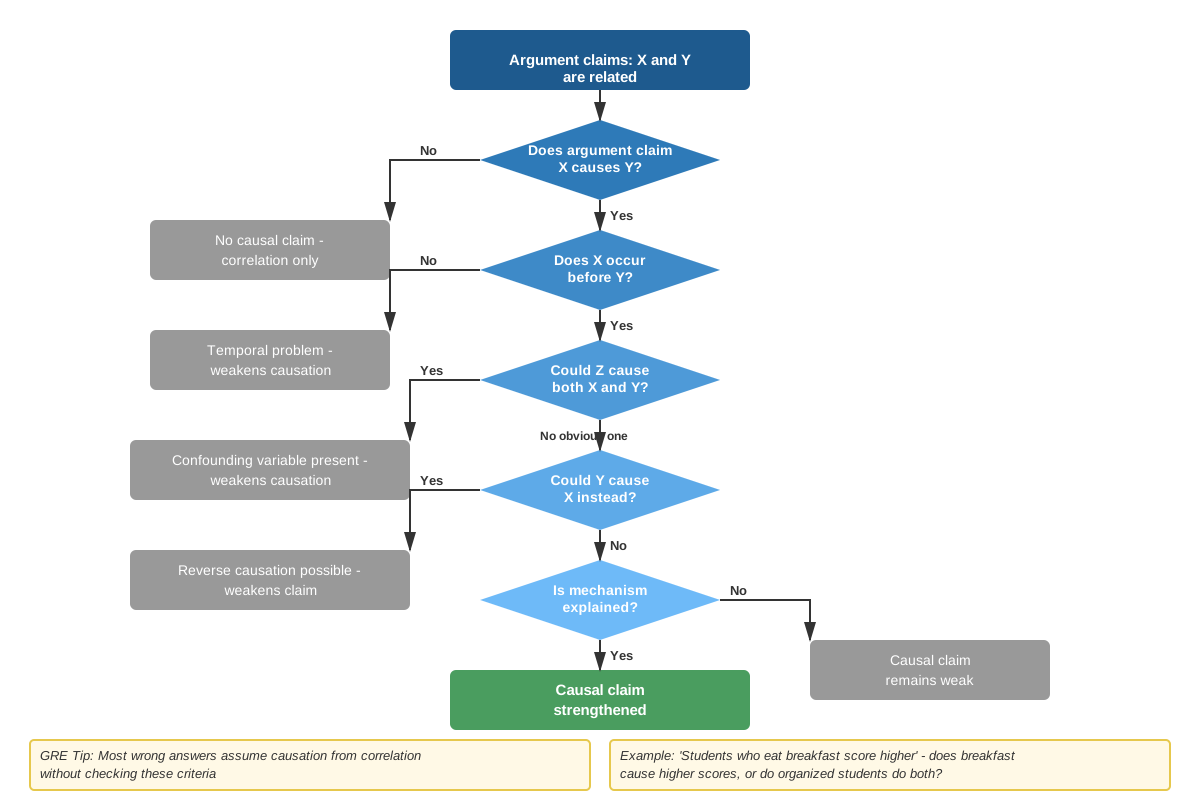
One of the most frequently tested statistical reasoning concepts is the distinction between correlation (two variables changing together) and causation (one variable directly causing changes in another). The GRE presents arguments that observe a correlation and incorrectly conclude causation exists.
Three key scenarios explain correlations without causation:
| Scenario | Explanation | Example |
|---|---|---|
| Reverse causation | Variable B causes Variable A, not vice versa | Argument claims exercise causes happiness, but happy people may be more likely to exercise |
| Common cause | Variable C causes both A and B | Ice cream sales and drowning deaths correlate because both increase in summer (temperature is the common cause) |
| Coincidence | No causal relationship exists; correlation is spurious | Number of Nicolas Cage films correlates with swimming pool drownings—purely coincidental |
GRE questions test this by asking what would strengthen or weaken a causal argument, or by asking what assumption the argument depends upon. The correct answer often involves ruling out alternative explanations for the observed correlation.
Statistical Relevance
Statistical relevance concerns whether the evidence provided actually addresses the conclusion being drawn. An argument exhibits irrelevant statistics when:
- The data measures something different from what the conclusion claims
- The time period of the data doesn't match the conclusion's timeframe
- The population studied differs from the population in the conclusion
- The metric used doesn't logically connect to the outcome claimed
For example, an argument might conclude that "Hospital A provides better care than Hospital B" based on evidence that "Hospital A has more advanced equipment." The equipment statistic, while potentially relevant, doesn't directly measure care quality—patient outcomes would be more relevant evidence.
Baseline and Comparison Issues
Many GRE statistical arguments fail because they present numbers without appropriate baseline comparisons or context. Common issues include:
Absolute vs. Relative Changes: An argument might state "Crime increased by 50 incidents" without providing the baseline (50 additional crimes in a city of 100,000 is very different from a town of 1,000).
Percentage vs. Absolute Numbers: "Product sales increased 200%" sounds impressive but might represent growth from 5 units to 15 units.
Missing Control Groups: Claims about a treatment's effectiveness require comparison to what happens without the treatment.
Temporal Comparisons: Comparing data from different time periods without accounting for other changes (e.g., comparing test scores from different years without noting curriculum changes).
Rate vs. Total Confusion
The GRE tests whether students recognize the difference between rates (proportions or percentages) and totals (absolute numbers). An argument might confuse these by:
- Concluding that a higher rate means a higher total (e.g., "City A has a higher crime rate than City B, therefore City A has more total crimes"—ignoring that City B might have a much larger population)
- Assuming changes in totals reflect changes in rates (e.g., "More students enrolled in advanced classes, therefore a higher percentage of students take advanced classes"—ignoring that total enrollment might have increased proportionally)
Extrapolation and Projection Errors
Extrapolation involves extending a trend beyond the observed data. The GRE presents arguments that inappropriately assume:
- Past trends will continue indefinitely into the future
- Trends observed in one context apply to different contexts
- Short-term patterns represent long-term trends
- Linear relationships continue beyond the observed range
For example, an argument might observe that "Company profits increased 10% annually for three years" and conclude "profits will double in seven years"—assuming the trend continues without justification.
Concept Relationships
Statistical reasoning concepts form an interconnected framework for evaluating data-based arguments. Sample representativeness and sample size adequacy work together to determine whether generalizations are justified—a large but biased sample remains problematic, as does a representative but tiny sample. Both concepts feed into the broader question of whether the evidence supports the conclusion.
Correlation vs. causation connects directly to assumption identification (a prerequisite skill), as causal arguments assume that alternative explanations have been ruled out. When an argument claims causation based on correlation, it implicitly assumes no reverse causation, no common cause, and no coincidence explain the relationship.
Statistical relevance serves as an overarching principle that encompasses the other concepts: irrelevant statistics might involve unrepresentative samples, inappropriate comparisons, or rate/total confusions. The relationship flows as:
Sample Issues (representativeness, size) → Generalization Validity → Statistical Relevance → Conclusion Support
Comparison Issues (baseline, rate vs. total) → Evidence Interpretation → Statistical Relevance → Conclusion Support
Correlation Observations → Causal Claims (with assumptions) → Conclusion Support
Understanding these relationships enables systematic evaluation: first assess whether the data collection was sound (sampling), then whether the data is interpreted correctly (comparisons, rates), then whether it addresses the conclusion (relevance), and finally whether causal claims are justified (correlation vs. causation).
High-Yield Facts
⭐ A correlation between two variables does not establish that one causes the other—alternative explanations include reverse causation, common causes, or coincidence.
⭐ A sample must be both sufficiently large AND representative—size alone doesn't overcome systematic bias in selection.
⭐ Self-selected samples (volunteers, survey respondents) are typically biased toward those with stronger opinions or greater interest in the topic.
⭐ Percentage changes require knowing the baseline—a 50% increase from 10 is very different from a 50% increase from 10,000.
⭐ Higher rates don't necessarily mean higher totals—a small group can have a higher percentage while a large group has more absolute cases.
- Statistical evidence is only relevant if it directly measures what the conclusion claims, not merely related concepts.
- Comparing data from different time periods requires accounting for other variables that may have changed.
- Extrapolating trends assumes stability of underlying conditions, which arguments must justify rather than assume.
- Control groups or baseline comparisons are necessary to establish that an intervention caused an observed effect.
- The absence of evidence for alternative explanations doesn't prove a causal claim—the argument must actively rule out alternatives.
- Small sample sizes are particularly problematic when drawing conclusions about diverse populations or rare events.
- Survey response rates matter—low response rates increase non-response bias risk.
Quick check — test yourself on Statistical reasoning so far.
Try Flashcards →Common Misconceptions
Misconception: If a study shows correlation, there must be some causal relationship between the variables, even if the direction is unclear.
Correction: Correlations can be entirely spurious (coincidental) or result from both variables being caused by a third factor, with no direct causal relationship between the correlated variables themselves.
Misconception: A large sample size automatically makes a study's conclusions valid and generalizable.
Correction: Sample size doesn't overcome systematic bias in selection. A survey of 10,000 volunteers still suffers from self-selection bias, while a properly randomized sample of 400 can be highly representative.
Misconception: If an argument's statistical evidence is accurate, the conclusion must be valid.
Correction: Accurate statistics can still be irrelevant to the conclusion, measure the wrong thing, lack appropriate comparisons, or be interpreted incorrectly. Truth of premises doesn't guarantee validity of reasoning.
Misconception: Strengthening a statistical argument requires providing more data or larger numbers.
Correction: Strengthening often involves addressing methodological flaws (showing the sample was representative, ruling out alternative explanations, providing relevant comparisons) rather than simply adding more data.
Misconception: When a study shows that Treatment A correlates with Outcome B, the assumption is simply that "A causes B."
Correction: The assumption is more complex—that no alternative explanation accounts for the correlation, including reverse causation, common causes, confounding variables, or coincidence. Multiple assumptions may be at play.
Misconception: Statistical reasoning questions require mathematical calculations or quantitative skills.
Correction: GRE Verbal statistical reasoning tests logical evaluation of how statistics are used in arguments, not calculation ability. The focus is on methodological soundness and logical validity.
Worked Examples
Example 1: Sampling Bias and Generalization
Passage: "A recent survey found that 78% of respondents believe that public transportation in the city is inadequate. The survey was conducted by distributing questionnaires at the main bus terminal during morning rush hour. Based on these results, the city council should prioritize expanding public transportation infrastructure."
Question: Which of the following, if true, most weakens the argument?
A) The survey included responses from over 500 people.
B) Many respondents indicated they use public transportation daily.
C) People who use public transportation regularly are more likely to be dissatisfied with it than the general population.
D) The city's population has grown by 15% in the past decade.
E) Expanding infrastructure would require significant tax increases.
Analysis:
This question tests sample representativeness and sampling bias. Let's identify the argument structure:
- Premise: 78% of survey respondents believe public transportation is inadequate
- Conclusion: The city should prioritize expanding public transportation
- Hidden assumption: The survey respondents represent the views of the general population
The critical flaw is the sampling method—surveying people at a bus terminal during rush hour creates severe self-selection bias. This sample consists exclusively of public transportation users, who likely have different views than the general population (including those who drive, work from home, or travel at different times).
Evaluating each choice:
A) Sample size doesn't address the bias issue—500 biased responses don't overcome systematic selection problems.
B) This actually strengthens the concern about bias—if respondents are daily users, they're even less representative of the general population.
C) CORRECT. This directly attacks the representativeness assumption by explaining why the sample (public transportation users) would systematically differ from the general population in their views on this specific issue.
D) Population growth is irrelevant to whether the survey sample represents current population views.
E) This addresses the feasibility of the conclusion but doesn't weaken the statistical reasoning connecting the survey to the conclusion.
Key Takeaway: When evaluating sampling, ask "Who was surveyed, and does that group represent the population the conclusion addresses?" Location and timing of data collection often introduce systematic bias.
Example 2: Correlation vs. Causation
Passage: "A study of 1,000 adults found that those who reported eating breakfast daily had 30% lower rates of obesity than those who skipped breakfast. Therefore, encouraging people to eat breakfast would be an effective strategy for reducing obesity rates."
Question: The argument depends on which of the following assumptions?
A) The 1,000 adults studied are representative of the general population.
B) Eating breakfast directly causes lower obesity rates rather than both being effects of other lifestyle factors.
C) The definition of "eating breakfast" was consistent across all participants.
D) Obesity rates have been increasing in recent years.
E) People who skip breakfast consume more calories later in the day.
Analysis:
This question tests the correlation vs. causation distinction. The argument structure:
- Premise: Correlation exists between eating breakfast and lower obesity rates
- Conclusion: Eating breakfast causes lower obesity (implied by "encouraging people to eat breakfast would reduce obesity")
- Logical gap: The correlation might not reflect causation
Evaluating the assumption:
The argument moves from observing a correlation to recommending an intervention, which only makes sense if the relationship is causal. Several alternative explanations could account for the correlation:
- Reverse causation: People who maintain healthy weight might be more likely to eat breakfast as part of overall health-consciousness
- Common cause: Disciplined lifestyle habits might cause both breakfast eating and healthy weight maintenance
- Confounding variables: Breakfast eaters might exercise more, sleep better, or have less stressful schedules
Evaluating each choice:
A) While representativeness matters, even if the sample is representative, the correlation-causation gap remains. This is necessary but not sufficient.
B) CORRECT. This directly addresses the causal assumption. If other lifestyle factors cause both breakfast eating and lower obesity, then encouraging breakfast alone wouldn't reduce obesity. The argument must assume the relationship is directly causal.
C) Definitional consistency affects data quality but doesn't address whether the relationship is causal.
D) Historical trends are irrelevant to whether breakfast causes lower obesity in the studied population.
E) This would actually support the causal mechanism, but the argument doesn't depend on this specific explanation—it just needs some causal connection to exist.
Key Takeaway: When an argument recommends an intervention based on observed correlation, it assumes the relationship is causal and that manipulating the independent variable will change the dependent variable. Always consider alternative explanations for correlations.
Exam Strategy
Recognizing Statistical Reasoning Questions
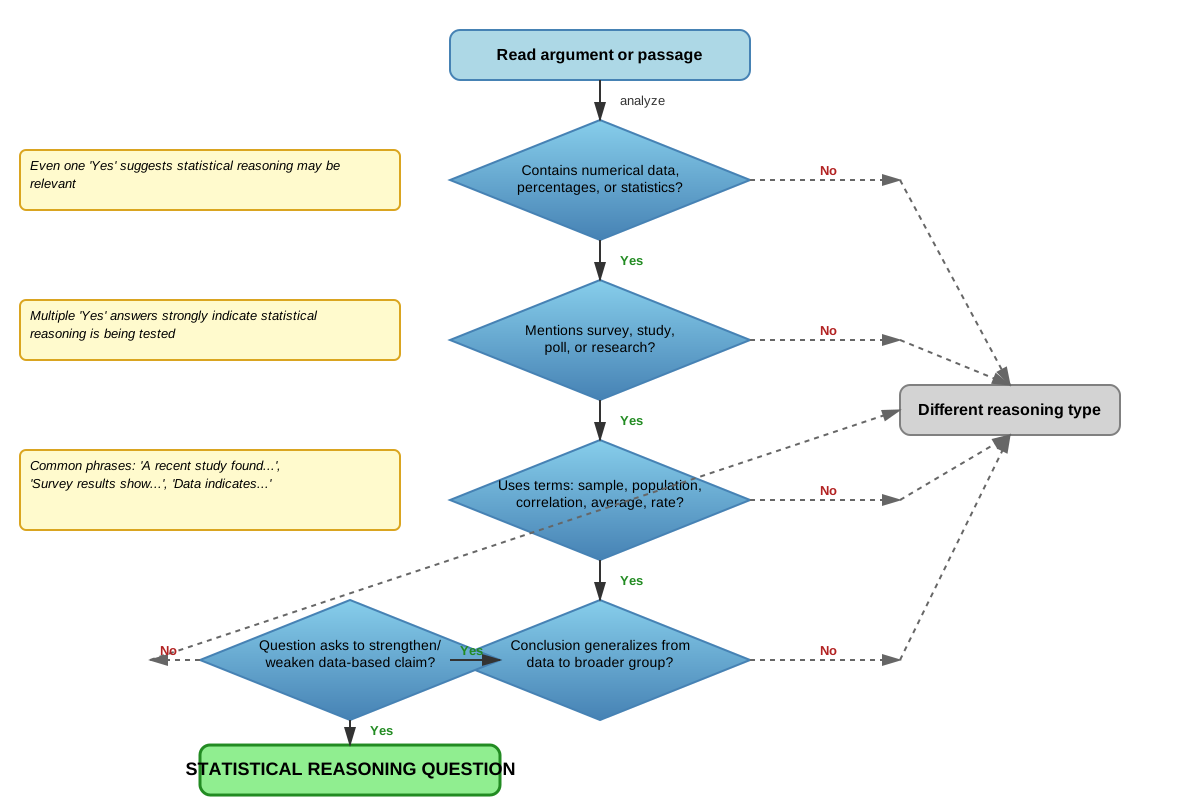
Watch for these trigger phrases that signal statistical reasoning is being tested:
- "A survey/study found that..."
- "Statistics show that..."
- "X percent of respondents..."
- "Rates of Y increased/decreased..."
- "Research indicates a correlation between..."
- "Data from [source] demonstrates..."
Systematic Approach
When encountering statistical reasoning questions, apply this four-step process:
- Identify the statistical claim: What data is presented, and what conclusion is drawn from it?
- Check the sample: Is it representative? Adequate size? How were participants selected? Any obvious bias?
- Examine the logic: Does the conclusion follow from the data? Is causation claimed from correlation? Are comparisons appropriate?
- Consider alternatives: What other explanations could account for the data? What's missing?
Process of Elimination Tips
For "weaken" questions, eliminate answers that:
- Provide irrelevant information that doesn't address the statistical reasoning
- Actually strengthen the argument by confirming assumptions
- Are too weak to significantly impact the conclusion
- Address feasibility rather than logical validity
For "assumption" questions, eliminate answers that:
- State information already provided in the passage
- Go beyond what's necessary for the conclusion
- Address tangential issues rather than the core statistical gap
- Would strengthen but aren't required for the argument to work
For "strengthen" questions, prioritize answers that:
- Address the most obvious methodological flaw
- Rule out alternative explanations
- Confirm sample representativeness
- Establish causal mechanisms when causation is claimed
Time Management
Statistical reasoning questions typically require 60-90 seconds. Allocate time as follows:
- 20 seconds: Read and identify the statistical claim and conclusion
- 20 seconds: Identify the primary flaw or gap
- 30 seconds: Evaluate answer choices
- 10 seconds: Confirm and select
Exam Tip: If you immediately spot a glaring sampling flaw or correlation-causation error, scan the answers for one that addresses it directly. The GRE often makes the correct answer obvious once you've identified the specific statistical issue.
Memory Techniques
SCRAP Acronym for Statistical Flaws
Sample bias - Was selection method biased?
Correlation ≠ Causation - Is causation claimed from correlation?
Relevance - Does the statistic measure what the conclusion claims?
Adequacy - Is sample size sufficient?
Proportion vs. Total - Are rates confused with absolute numbers?
Visualization for Correlation vs. Causation
Picture three scenarios as simple diagrams:
- Direct causation: A → B (arrow from cause to effect)
- Reverse causation: A ← B (arrow goes the opposite direction)
- Common cause: C → A and C → B (third factor causes both)
When you see correlation claimed as causation, mentally draw these three diagrams and ask which the argument assumes.
The "Representative Sample" Checklist
Remember R.A.N.D.O.M. for sample quality:
- Randomly selected (not self-selected)
- Adequate size for the population
- No systematic exclusions
- Diverse enough to represent variation
- Objective selection criteria
- Matches the population in the conclusion
Summary
Statistical reasoning on the GRE Verbal section tests the ability to evaluate arguments based on numerical evidence, surveys, and studies. Rather than requiring calculations, these questions assess whether conclusions are logically supported by statistical evidence. The core concepts include sample representativeness and bias (whether the sample accurately reflects the population), sample size adequacy (whether enough observations support the conclusion), correlation versus causation (whether observed relationships are incorrectly interpreted as causal), statistical relevance (whether evidence actually addresses the conclusion), and comparison issues (whether appropriate baselines and contexts are provided). Success requires systematically checking for sampling flaws, questioning causal claims derived from correlations, verifying that statistics measure what conclusions claim, and considering alternative explanations for observed data. The GRE repeatedly tests these patterns across Reading Comprehension, Critical Reasoning, and Analytical Writing, making statistical reasoning a high-yield topic that rewards focused preparation with rapid score improvements.
Key Takeaways
- Statistical reasoning questions test logical evaluation of data-based arguments, not mathematical calculation ability—focus on methodological soundness and logical validity.
- The two most frequently tested concepts are sampling bias and correlation-causation confusion—master these for immediate score improvement.
- Sample representativeness matters more than sample size—a large biased sample is worse than a smaller representative one.
- When arguments claim causation from correlation, they assume alternative explanations have been ruled out—reverse causation, common causes, and confounding variables are key alternatives.
- Statistical evidence must be relevant to the specific conclusion drawn—accurate statistics about related topics don't support conclusions about different topics.
- Use the SCRAP acronym to systematically check for statistical flaws: Sample bias, Correlation ≠ Causation, Relevance, Adequacy, Proportion vs. Total.
- Process of elimination is powerful for statistical reasoning questions—identifying the specific flaw helps you predict and recognize the correct answer quickly.
Related Topics
Causal Reasoning: Statistical reasoning overlaps significantly with causal reasoning, as many statistical arguments make causal claims. Mastering statistical reasoning provides the foundation for evaluating whether evidence supports causal conclusions.
Argument Structure Analysis: Understanding how premises support conclusions is essential for identifying where statistical evidence fits within an argument and whether it actually supports the conclusion claimed.
Assumption Identification: Statistical arguments depend on assumptions about sample quality, causal relationships, and data relevance. Strengthening assumption identification skills enhances statistical reasoning performance.
Strengthen and Weaken Questions: These question types frequently involve statistical evidence. Mastering statistical reasoning enables rapid identification of which answer choices address methodological flaws versus irrelevant information.
Analytical Writing - Analyze an Argument: The essay task often presents arguments with statistical flaws. Statistical reasoning skills directly transfer to identifying and articulating these flaws in written form.
Practice CTA
Now that you understand the core principles of statistical reasoning, it's time to apply these concepts to actual GRE-style questions. The practice questions and flashcards will reinforce your ability to quickly identify sampling flaws, distinguish correlation from causation, and evaluate whether statistical evidence supports conclusions. Each practice question you complete strengthens your pattern recognition, making these questions faster and easier on test day. Remember: statistical reasoning is one of the highest-yield topics for score improvement because the same flaws appear repeatedly across test forms. Your investment in mastering these concepts will pay dividends throughout the Verbal section!
Sign up free to keep reading
Create a free AnvayaPrep account to finish this GRE guide on Statistical reasoning — plus flashcards and practice questions.