Overview
Survey flaws represent one of the most frequently tested concepts in GRE Verbal Reasoning, particularly within the Critical Reasoning section. When the GRE presents arguments based on survey data, polls, questionnaires, or statistical sampling, test-makers deliberately embed methodological weaknesses that undermine the validity of the conclusions drawn. Recognizing these flaws requires students to think critically about how data is collected, who participates, how questions are framed, and whether the sample accurately represents the population being studied.
Understanding GRE survey flaws is essential because these questions appear regularly in both "Weaken the Argument" and "Evaluate the Argument" question types, and occasionally in "Assumption" questions. The GRE rewards students who can quickly identify when an argument relies on survey evidence and systematically evaluate whether that evidence supports the conclusion. Unlike pure logical reasoning questions, survey flaw questions require specific knowledge about research methodology, sampling techniques, and statistical validity—making this a learnable, high-yield skill set.
This topic connects directly to broader Critical Reasoning concepts including evidence evaluation, assumption identification, and argument structure analysis. Survey flaw questions test the same fundamental skill as other argument questions—assessing whether evidence adequately supports a conclusion—but they require specialized knowledge about what makes survey evidence reliable or unreliable. Mastering survey flaws strengthens overall critical thinking abilities and provides a systematic framework for attacking a significant subset of GRE Verbal questions.
Learning Objectives
- [ ] Identify when Survey flaws is being tested in GRE questions
- [ ] Explain the core rule or strategy behind Survey flaws
- [ ] Apply Survey flaws to GRE-style questions accurately
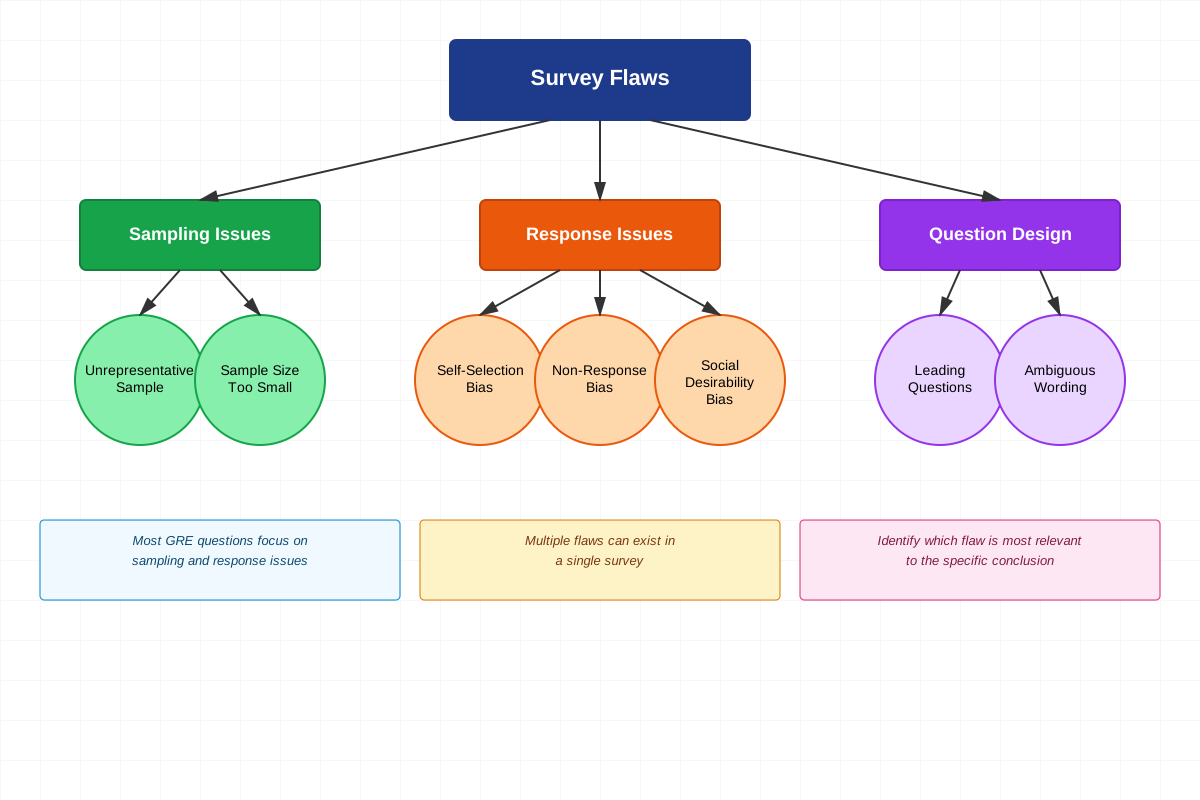
- [ ] Distinguish between different types of survey flaws (sampling bias, response bias, question wording issues)
- [ ] Evaluate whether a given survey provides adequate support for a stated conclusion
- [ ] Generate potential weaknesses in survey-based arguments without seeing answer choices
Prerequisites
- Basic argument structure: Understanding premises, conclusions, and how evidence supports claims is essential because survey flaw questions are fundamentally argument evaluation questions with survey-specific complications.
- Logical reasoning fundamentals: Familiarity with strengthening, weakening, and assumption questions provides the framework for understanding how survey flaws undermine arguments.
- Reading comprehension skills: The ability to parse complex sentences and identify the author's main claim is necessary to distinguish between the survey findings and the conclusions drawn from them.
Why This Topic Matters
Survey-based arguments appear in approximately 15-20% of all GRE Critical Reasoning questions, making this one of the highest-yield topics for focused study. The GRE frequently uses surveys because they provide rich opportunities to test critical thinking: a single survey can contain multiple methodological flaws, and students must identify which flaw is most relevant to the specific conclusion being drawn.
In real-world contexts, the ability to evaluate survey quality is increasingly important as data-driven claims proliferate in business, policy, journalism, and academic research. Graduate programs value students who can critically assess statistical evidence rather than accepting numerical data at face value. This skill directly translates to evaluating research literature, designing studies, and making evidence-based decisions.
On the GRE, survey flaw questions typically appear as "Weaken" questions where answer choices identify methodological problems, or as "Evaluate" questions where students must determine what additional information would help assess the argument's validity. Less commonly, they appear as "Assumption" questions where the correct answer states a condition necessary for the survey to support the conclusion. The test-makers favor surveys about consumer preferences, public opinion, workplace trends, and health behaviors—topics where sampling and response biases are particularly relevant.
Core Concepts
What Constitutes a Survey Flaw
A survey flaw is any methodological weakness in data collection, sample selection, question design, or interpretation that undermines the validity of conclusions drawn from survey results. These flaws create a gap between what the survey actually demonstrates and what the argument claims it demonstrates. The GRE tests whether students can identify this gap and recognize why the survey evidence is insufficient or inappropriate for supporting the stated conclusion.
Survey flaws differ from general logical fallacies because they involve specific technical problems with empirical research methods. While a logical fallacy might involve faulty reasoning from premises to conclusion, a survey flaw involves faulty data collection that makes the premises themselves unreliable or unrepresentative.
Sampling Bias and Representativeness
Sampling bias occurs when the group surveyed differs systematically from the population about which conclusions are drawn. This is the most common survey flaw on the GRE. For a survey to support generalizations about a population, the sample must be representative—meaning it accurately reflects the characteristics, opinions, and behaviors of the larger group.
Common forms of sampling bias include:
- Self-selection bias: When participation is voluntary, respondents may differ from non-respondents in ways that affect results. People with strong opinions are more likely to complete surveys than those with moderate views.
- Convenience sampling: Surveying only easily accessible individuals (e.g., people at a specific location, subscribers to a particular magazine) creates samples that don't represent the broader population.
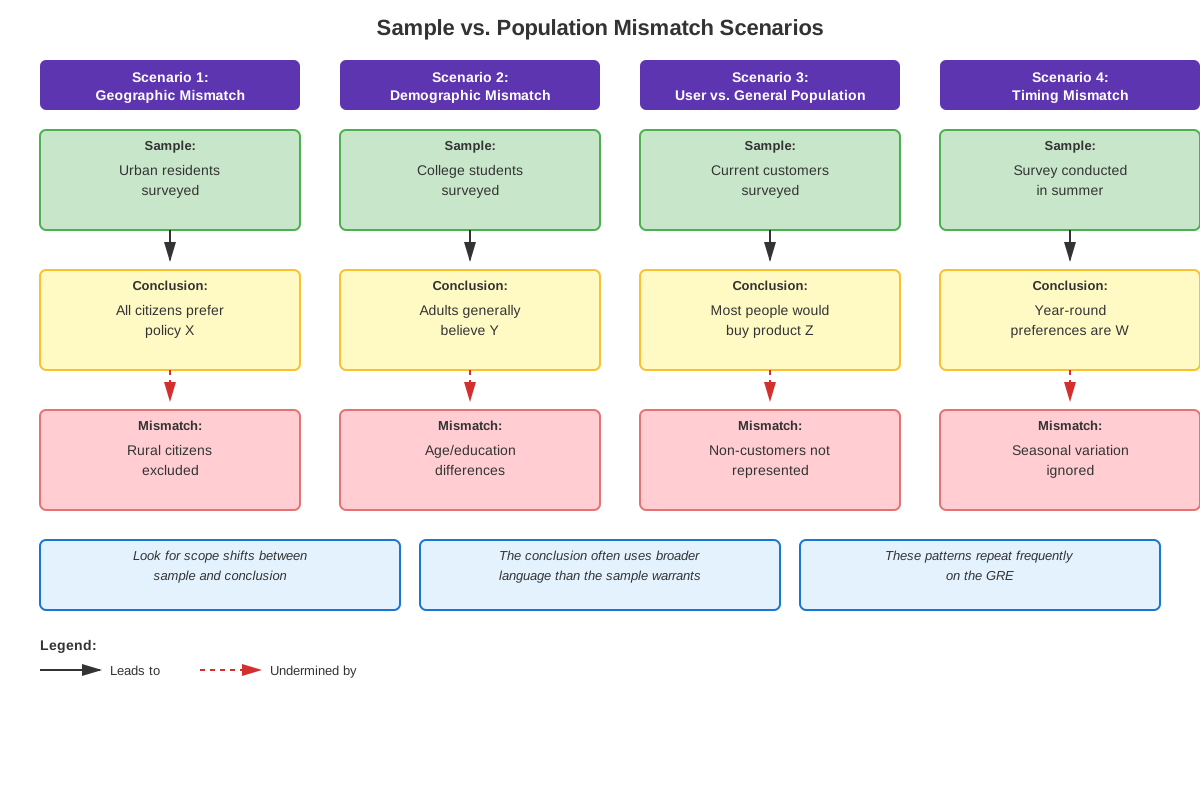
- Exclusion of relevant subgroups: If certain demographic groups, geographic regions, or user types are systematically excluded, conclusions about "all" members of a population are unwarranted.
For example, if a company surveys only customers who registered complaints to conclude that "most customers are dissatisfied," the sample is biased because satisfied customers rarely contact companies. The survey tells us about complainers, not about customers generally.
Response Rate and Non-Response Bias
Response rate refers to the percentage of surveyed individuals who actually complete the survey. Low response rates create non-response bias when people who respond differ systematically from those who don't. The GRE frequently tests whether students recognize that a survey's findings might not represent the views of non-respondents.
Consider a workplace satisfaction survey with a 15% response rate. Even if 90% of respondents report high satisfaction, this doesn't mean 90% of all employees are satisfied—it means 90% of the 15% who chose to respond are satisfied. The 85% who didn't respond might be less satisfied, too busy, or indifferent. Without knowing why people didn't respond, we cannot generalize from respondents to the entire workforce.
Question Wording and Leading Questions
Question wording significantly influences survey results. Leading questions suggest a desired answer or frame issues in ways that bias responses. The GRE tests whether students recognize that how a question is asked affects what answers are obtained.
Examples of problematic question wording:
- "Do you support the wasteful spending on Program X?" (loaded language)
- "Given the health benefits, do you exercise regularly?" (suggests a "correct" answer)
- "Do you oppose the policy?" versus "Do you support the policy?" (negative vs. positive framing can yield different results)
Vague or ambiguous terms also create problems. If a survey asks "Do you frequently use our service?" without defining "frequently," respondents interpret the term differently, making results difficult to interpret.
Timing and Context Effects
Timing of survey administration can affect results when opinions or behaviors fluctuate over time. A survey about shopping habits conducted only during the holiday season won't accurately represent year-round patterns. Similarly, surveys conducted immediately after major events (scandals, product launches, news stories) may capture temporary reactions rather than stable attitudes.
Context effects occur when the survey setting or recent events influence responses. Surveying restaurant satisfaction while customers are still in the restaurant may yield different results than follow-up surveys days later. The GRE tests whether students recognize that when and where a survey is conducted affects its validity for supporting particular conclusions.
Comparison Group Problems
Many GRE survey arguments compare two groups or track changes over time. Comparison group problems arise when groups differ in ways beyond the variable of interest, making it unclear what explains observed differences.
For instance, if a survey finds that employees at Company A report higher job satisfaction than employees at Company B, we cannot conclude that Company A's policies cause greater satisfaction without knowing whether the companies differ in industry, location, salary levels, or employee demographics. The survey shows a correlation but doesn't establish causation or control for confounding variables.
Interpretation and Scope Issues
Interpretation issues occur when arguments draw conclusions that go beyond what survey data actually shows. Common problems include:
- Confusing correlation with causation: Survey data shows two variables are related but doesn't prove one causes the other
- Overgeneralization: Extending findings beyond the surveyed population (e.g., from college students to all adults)
- Temporal assumptions: Assuming current survey results will hold in the future or did hold in the past
- Misinterpreting percentages: Confusing percentage of respondents with percentage of the total population
The scope of a survey's conclusions must match the scope of its methodology. A survey of urban residents cannot support conclusions about rural residents; a survey about preferences cannot support conclusions about actual behaviors.
Concept Relationships
The various survey flaws interconnect in important ways. Sampling bias is the foundational concept because if the sample doesn't represent the population, all other methodological strengths become irrelevant—the data simply doesn't tell us about the group we care about. Response rate problems are a specific type of sampling bias where the issue isn't who was surveyed but who actually responded.
Question wording issues affect what data is collected, while interpretation problems affect how that data is used to support conclusions. Even a perfectly representative sample with high response rates can lead to invalid conclusions if questions are leading or if results are misinterpreted.
Timing and context effects interact with sampling bias: a survey might sample the right population but at the wrong time, or in a context that doesn't reflect typical conditions. Comparison group problems combine sampling and interpretation issues—the samples might be biased, or the interpretation might ignore relevant differences between groups.
The relationship map flows as follows:
Survey Design → Sample Selection (potential sampling bias) → Question Administration (potential wording/timing issues) → Response Collection (potential response rate problems) → Data Interpretation (potential scope/causation issues) → Conclusion
Each stage introduces potential flaws, and GRE questions may focus on any stage. Understanding this progression helps students systematically evaluate survey-based arguments.
Quick check — test yourself on Survey flaws so far.
Try Flashcards →High-Yield Facts
⭐ Sampling bias is the most frequently tested survey flaw on the GRE—always check whether the surveyed group represents the population about which conclusions are drawn.
⭐ Self-selection bias occurs when survey participation is voluntary, making respondents potentially different from non-respondents in ways that affect results.
⭐ Low response rates create non-response bias because people who respond may differ systematically from those who don't, preventing generalization to the entire surveyed population.
⭐ Question wording affects responses—leading questions, loaded language, and ambiguous terms can bias results and make surveys unreliable.
⭐ Survey timing matters: surveys conducted during atypical periods or immediately after significant events may not reflect stable patterns or typical conditions.
- Correlation shown in survey data does not establish causation—other factors might explain observed relationships.
- A survey of current users cannot support conclusions about former users or non-users without additional evidence.
- Comparing two groups requires that they be similar in all relevant respects except the variable of interest.
- Surveys about intentions or preferences don't necessarily predict actual behaviors.
- The scope of conclusions must match the scope of the surveyed population—findings about one demographic group don't automatically apply to others.
- Response bias occurs when the survey setting or format encourages certain types of answers over others.
- A large sample size doesn't compensate for sampling bias—a biased sample remains unrepresentative regardless of size.
Common Misconceptions
Misconception: A large sample size guarantees survey reliability. → Correction: Sample size matters less than sample representativeness. A survey of 10,000 magazine subscribers is less informative about the general population than a survey of 500 randomly selected individuals. Biased samples remain biased regardless of size.
Misconception: If most survey respondents hold a view, most people in the population hold that view. → Correction: This assumes respondents represent the population and that non-respondents would answer similarly. Both assumptions require justification. Low response rates and self-selection bias often mean respondents differ from the broader population.
Misconception: Survey flaws always completely invalidate the argument. → Correction: On the GRE, the question is whether a flaw is relevant to the specific conclusion being drawn. Some flaws weaken arguments without destroying them entirely. The correct answer identifies the most significant flaw for the particular conclusion stated.
Misconception: Any difference in survey methodology between two groups being compared is a fatal flaw. → Correction: The relevant question is whether the methodological difference affects the specific comparison being made. Some differences are irrelevant to the conclusion; others are critical. Focus on differences that could explain the observed results.
Misconception: Surveys about the past are just as reliable as surveys about the present. → Correction: Surveys asking people to recall past behaviors or opinions are subject to memory errors and retrospective bias. People's memories are imperfect and often influenced by current beliefs. Surveys about current states are generally more reliable than those requiring recall.
Worked Examples
Example 1: Sampling Bias
Argument: "A recent survey found that 85% of respondents prefer Brand X coffee to Brand Y. The survey was conducted by asking shoppers at a Brand X retail store whether they preferred Brand X or Brand Y. Therefore, Brand X is more popular than Brand Y among coffee drinkers generally."
Question: Which of the following identifies the most serious flaw in the argument?
Analysis:
- Identify the conclusion: Brand X is more popular than Brand Y among coffee drinkers generally.
- Identify the evidence: A survey showing 85% preference for Brand X.
- Identify the survey methodology: Respondents were shoppers at a Brand X store.
- Evaluate representativeness: People shopping at a Brand X store are likely already Brand X customers or at least interested in Brand X. This sample is highly unrepresentative of "coffee drinkers generally."
- Connect flaw to conclusion: The sampling bias means we cannot generalize from Brand X store shoppers to all coffee drinkers. The survey tells us that Brand X customers prefer Brand X (unsurprising) but not whether coffee drinkers generally prefer it.
Correct answer type: The survey sample consists of individuals who are not representative of coffee drinkers generally / The survey was conducted among people already predisposed to favor Brand X.
Learning objective connection: This example demonstrates identifying when survey flaws are being tested (survey evidence supporting a generalization) and applying the core concept of sampling bias to evaluate the argument.
Example 2: Response Rate and Question Wording
Argument: "City officials mailed a questionnaire to all 50,000 residents asking 'Do you support the proposed tax increase to fund essential city services?' Only 3,000 residents returned the questionnaire, and 70% of those respondents indicated support. Officials concluded that most city residents support the tax increase."
Question: The argument is most vulnerable to which criticism?
Analysis:
- Identify the conclusion: Most city residents support the tax increase.
- Identify the evidence: 70% of survey respondents support it.
- Calculate response rate: 3,000 out of 50,000 = 6% response rate.
- Identify multiple potential flaws:
- Response rate problem: Only 6% responded. The 94% who didn't respond might have different views. People who support the tax might be more motivated to respond.
- Question wording: Describing services as "essential" is leading language that encourages support.
- Determine most serious flaw: The 6% response rate is more fundamental because even if the question were neutrally worded, we still couldn't generalize from 6% to "most residents." The non-response bias is the primary issue.
Correct answer type: The residents who responded to the questionnaire may not be representative of residents generally / Those who support the tax increase may have been more likely to respond than those who oppose it.
Learning objective connection: This example requires distinguishing between different types of survey flaws and determining which is most relevant to the specific conclusion, demonstrating advanced application of survey flaw concepts.
Exam Strategy
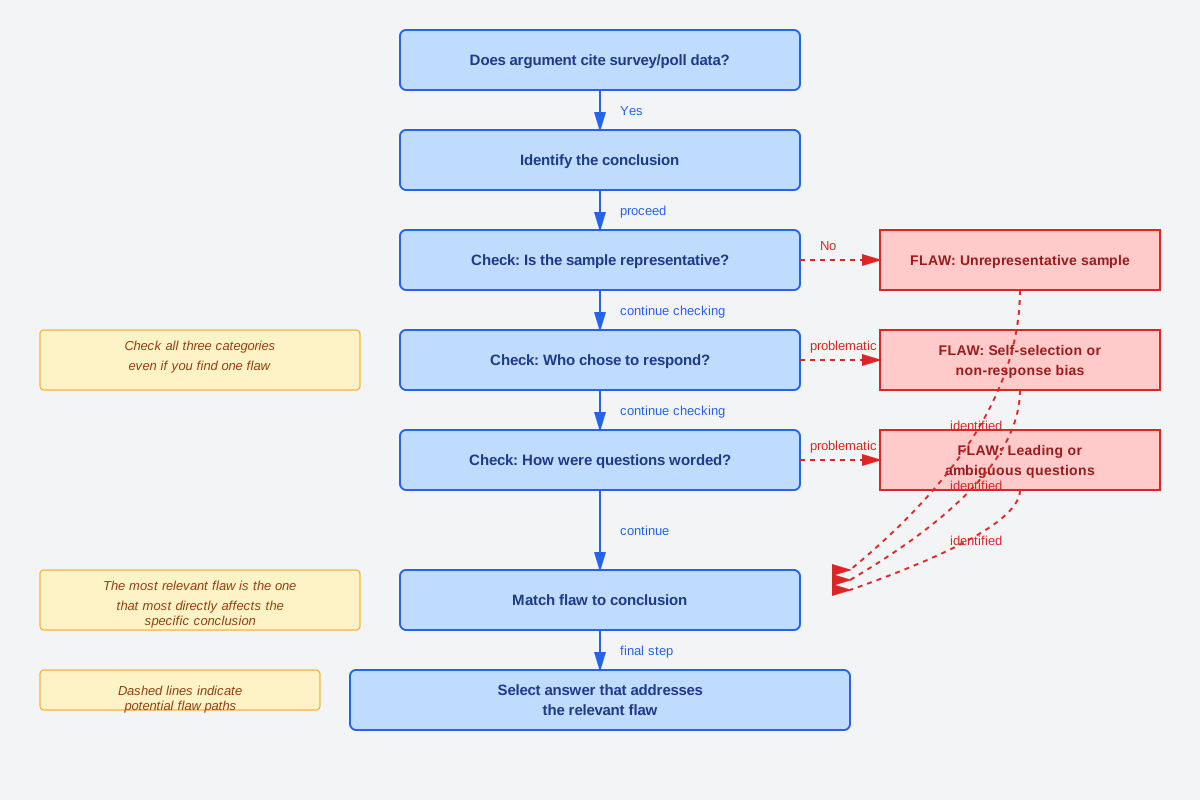
When approaching GRE questions involving surveys, follow this systematic process:
Step 1: Identify that survey evidence is present. Trigger words include "survey," "poll," "questionnaire," "study," "respondents," "participants," "sample," and phrases like "X% of those surveyed" or "researchers asked."
Step 2: Separate the survey findings from the conclusion. The survey findings are what the data actually shows (e.g., "70% of respondents said X"). The conclusion is what the argument claims based on those findings (e.g., "therefore, most people believe X"). The gap between these is where flaws exist.
Step 3: Ask the four key questions:
- Who was surveyed? (sampling bias check)
- Who responded? (response rate check)
- How were they asked? (question wording check)
- What does the conclusion claim? (scope and interpretation check)
Step 4: Match the flaw to the conclusion. The correct answer will identify a flaw that specifically undermines the stated conclusion. A survey might have multiple flaws, but only one is most relevant to what the argument is trying to prove.
Exam Tip: In "Weaken" questions, look for answer choices that suggest the sample is unrepresentative, the response rate is problematic, or the conclusion overgeneralizes. In "Evaluate" questions, look for choices that ask about sample representativeness or response rates.
Time allocation: Spend 10-15 seconds identifying the survey methodology and conclusion, then 30-45 seconds evaluating answer choices. Don't get distracted by flaws that don't affect the specific conclusion stated.
Process of elimination: Eliminate answer choices that identify real flaws but ones irrelevant to the conclusion, or that point out features that aren't actually flaws (e.g., "the survey was conducted by email" isn't inherently a flaw unless the argument requires reaching people without email access).
Memory Techniques
SQRR Mnemonic for evaluating surveys:
- Sample: Is the sample representative of the population?
- Questions: Are questions worded neutrally and clearly?
- Response rate: Did enough people respond to avoid non-response bias?
- Reach: Does the conclusion reach beyond what the data shows?
The "Who, What, When, Where" Framework:
- Who was surveyed and who responded? (sampling and response bias)
- What questions were asked and what did they actually measure? (question wording and interpretation)
- When was the survey conducted? (timing issues)
- Where does the conclusion go beyond the data? (scope issues)
Visualization: Picture a funnel narrowing from "entire population" → "surveyed group" → "respondents" → "conclusion." At each narrowing, ask whether the next level still represents the previous one. Where the funnel breaks, there's a flaw.
Acronym for common flaws - BLAST:
- Biased sample
- Leading questions
- Assumptions about non-respondents
- Scope exceeds data
- Timing issues
Summary
Survey flaws represent a high-yield, learnable category of GRE Critical Reasoning questions that test whether students can evaluate the quality of empirical evidence. The core principle is that survey evidence only supports conclusions about the population surveyed when the sample is representative, response rates are adequate, questions are neutrally worded, and interpretations don't exceed what the data actually shows. The most frequently tested flaw is sampling bias—when the surveyed group differs systematically from the population about which conclusions are drawn. Response rate problems, question wording issues, timing effects, and interpretation errors also appear regularly. Success on these questions requires systematically evaluating who was surveyed, who responded, how they were asked, and whether the conclusion's scope matches the data's scope. By learning to identify these specific methodological weaknesses, students can confidently approach survey-based arguments and select answer choices that identify the most relevant flaw for the stated conclusion.
Key Takeaways
- Survey flaw questions appear in 15-20% of GRE Critical Reasoning questions, making this a high-yield topic for focused study
- Sampling bias (unrepresentative samples) is the most commonly tested survey flaw—always verify that the surveyed group represents the population about which conclusions are drawn
- Low response rates create non-response bias because respondents may differ systematically from non-respondents
- Question wording affects results—leading questions and loaded language bias responses and undermine survey validity
- The scope of conclusions must match the scope of the survey: findings about one group, time period, or context don't automatically apply to others
- Evaluate surveys using SQRR: Sample representativeness, Question wording, Response rate, and Reach of conclusions
- The correct answer identifies the flaw most relevant to the specific conclusion stated, not just any flaw present in the survey
Related Topics
Causal Reasoning Flaws: Survey data often shows correlations that arguments incorrectly interpret as causal relationships. Understanding causal reasoning flaws deepens the ability to evaluate how survey evidence is interpreted.
Assumption Questions: Many survey-based arguments rely on unstated assumptions about sample representativeness or response patterns. Mastering survey flaws provides the foundation for identifying these assumptions.
Strengthen/Weaken Questions: Survey flaws appear most frequently in weaken questions, but understanding them also helps identify what information would strengthen survey-based arguments.
Statistical Reasoning: More advanced statistical concepts like margin of error, confidence intervals, and significance testing occasionally appear in GRE questions and build on the foundational survey flaw concepts.
Mastering survey flaws enables progression to more sophisticated argument evaluation skills and provides a systematic framework applicable across multiple question types.
Practice CTA
Now that you understand the core concepts behind survey flaws, it's time to apply this knowledge to actual GRE-style questions. The practice questions and flashcards will reinforce your ability to quickly identify survey methodologies, spot representativeness issues, and select answer choices that identify the most relevant flaws. Remember: survey flaw questions are highly learnable—with focused practice, you can master this high-yield topic and confidently approach 15-20% of all Critical Reasoning questions. Start practicing now to transform this knowledge into test-day points!
Sign up free to keep reading
Create a free AnvayaPrep account to finish this GRE guide on Survey flaws — plus flashcards and practice questions.