Overview
Data comparison is a critical skill tested extensively in the GRE Quantitative Reasoning section, particularly within Quantitative Comparison questions. This topic requires students to analyze numerical information, statistical data, and graphical representations to determine relationships between two quantities. Unlike traditional problem-solving questions that ask for a specific numerical answer, GRE data comparison questions demand that test-takers evaluate which of two quantities is larger, whether they are equal, or whether the relationship cannot be determined from the given information.
Mastering data comparison is essential because it represents approximately 40% of the Quantitative Reasoning section on the GRE. These questions test not only computational skills but also logical reasoning, estimation abilities, and the capacity to work efficiently under time pressure. Students who excel at data comparison can often solve problems in 30-45 seconds rather than the full 90 seconds allocated per question, creating valuable time for more complex problems. The format is unique to the GRE and requires specific strategies that differ from standard mathematical problem-solving approaches.
Data comparison connects to virtually every other Quantitative Reasoning concept tested on the GRE, including arithmetic, algebra, geometry, and data analysis. It serves as an integrative skill that requires students to apply multiple mathematical principles simultaneously while making strategic decisions about when to calculate exactly versus when to estimate. Understanding data comparison strategies enhances overall quantitative reasoning ability and improves performance across all question types by developing critical thinking skills about numerical relationships and comparative analysis.
Learning Objectives
- [ ] Identify when Data comparison is being tested
- [ ] Explain the core rule or strategy behind Data comparison
- [ ] Apply Data comparison to GRE-style questions accurately
- [ ] Distinguish between situations requiring exact calculation versus estimation
- [ ] Recognize the four standard answer choices and when each applies
- [ ] Develop systematic approaches to avoid common comparison errors
- [ ] Execute strategic substitution techniques for variable-based comparisons
Prerequisites
- Basic arithmetic operations: Essential for performing calculations and comparisons between numerical quantities
- Algebraic manipulation: Required for simplifying expressions and isolating variables in comparison problems
- Understanding of inequalities: Necessary for determining which quantity is greater or whether relationships hold
- Properties of positive and negative numbers: Critical for avoiding sign errors when comparing quantities
- Exponent and root rules: Needed for comparing expressions involving powers and radicals
- Fraction and decimal operations: Important for comparing rational numbers in various forms
Why This Topic Matters
Data comparison questions appear in approximately 13-15 of the 40 Quantitative Reasoning questions on the GRE, making them the single most common question format. Unlike multiple-choice problem-solving questions, Quantitative Comparison questions always present exactly two quantities (Quantity A and Quantity B) and ask test-takers to determine their relationship. This consistency in format allows students who master the specific strategies to gain a significant scoring advantage.
In real-world applications, data comparison skills translate directly to decision-making scenarios in business, research, and everyday life. Professionals constantly evaluate competing options, compare financial projections, analyze experimental results, and make judgments about relative magnitudes without necessarily calculating exact values. The ability to quickly assess relationships between quantities is fundamental to quantitative literacy in graduate-level work across disciplines.
On the GRE, data comparison appears in several distinct forms: pure numerical comparisons, algebraic expressions with variables, geometric figure comparisons, word problems requiring setup and comparison, and data interpretation questions involving charts or graphs. The questions may include centered information that applies to both quantities, or each quantity may be self-contained. Approximately 60% of data comparison questions can be solved more efficiently through estimation and strategic reasoning rather than complete calculation, making this topic particularly high-yield for students who learn the appropriate techniques.
Core Concepts
The Four Answer Choices
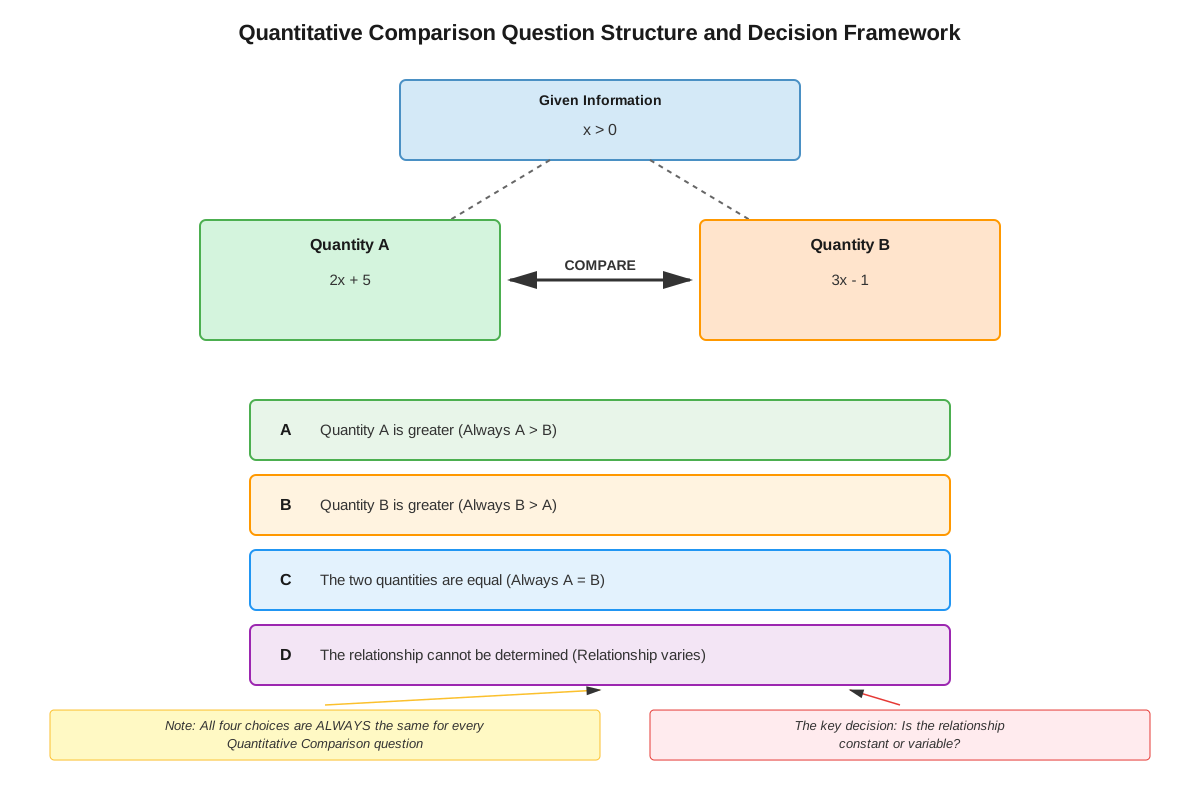
Every data comparison question on the GRE presents exactly four answer choices, which remain constant across all questions:
- (A) Quantity A is greater
- (B) Quantity B is greater
- (C) The two quantities are equal
- (D) The relationship cannot be determined from the information given
Understanding when each answer applies is fundamental to success. Answer choice (D) can only be correct when the problem includes variables or unknown quantities that could take different values, leading to different relationships. If a question contains only concrete numbers with no variables, answer (D) is never correct.
The Comparison Process
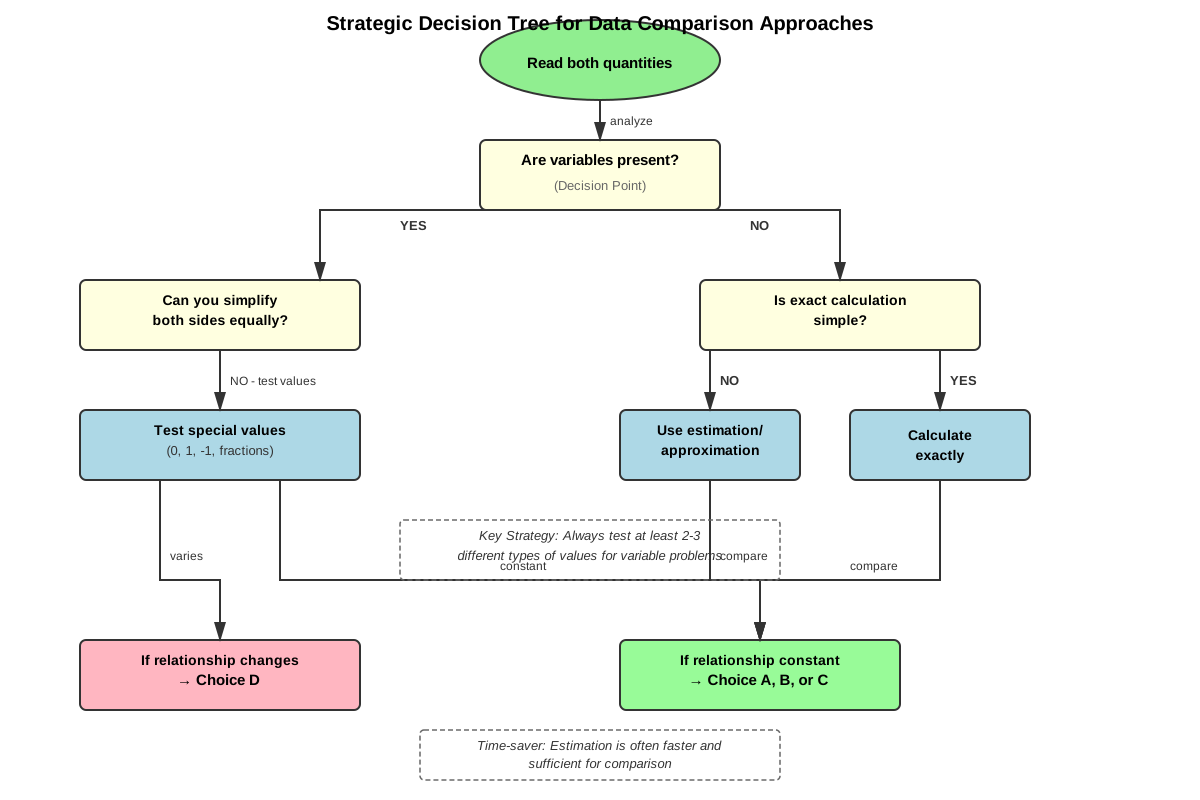
The systematic approach to data comparison involves several key steps:
- Analyze the centered information: Read any information provided above both quantities, as this applies to both Quantity A and Quantity B
- Examine both quantities: Understand what each quantity represents before attempting any calculations
- Determine if variables exist: Identify whether the problem contains unknowns that could vary
- Choose a strategy: Decide whether to calculate exactly, estimate, simplify, or test values
- Compare efficiently: Use the minimum work necessary to determine the relationship
- Verify the answer: Confirm that the relationship holds for all possible cases
Strategic Simplification
One of the most powerful techniques in data comparison is strategic simplification. Since the goal is only to determine which quantity is larger (not to find exact values), test-takers can often simplify both quantities simultaneously without changing their relationship.
Valid simplification operations that preserve the relationship between quantities:
| Operation | Example | Condition |
|---|---|---|
| Add/subtract the same value from both | If A > B, then A + 5 > B + 5 | Always valid |
| Multiply/divide both by the same positive number | If A > B, then 3A > 3B | Number must be positive |
| Square both quantities | If A > B ≥ 0, then A² > B² | Both must be non-negative |
| Take positive roots of both | If A > B > 0, then √A > √B | Both must be positive |
Invalid operations that can reverse or change relationships:
- Multiplying or dividing by a negative number (reverses inequality)
- Multiplying or dividing by a variable that could be positive, negative, or zero
- Squaring when quantities could be negative
- Cross-multiplying when denominators could have different signs
Testing Strategic Values
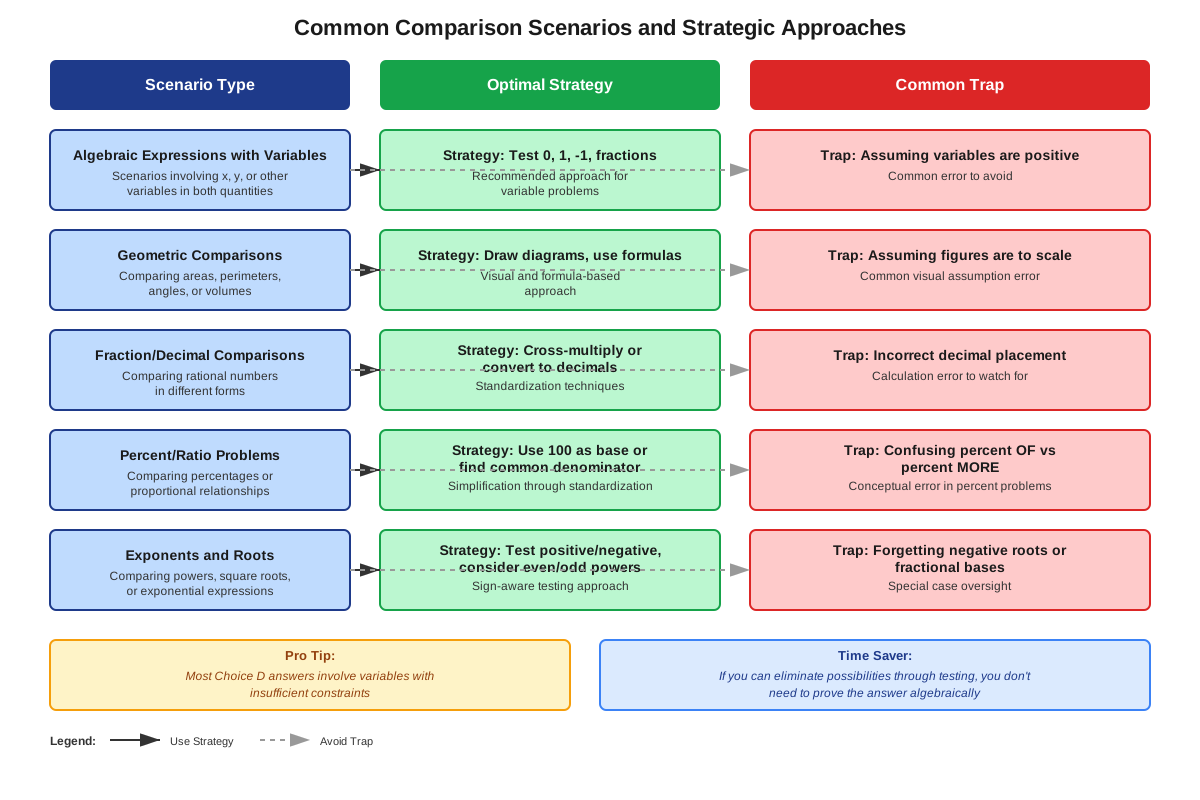
When variables appear in a data comparison question, testing strategic values helps determine whether the relationship is constant or variable. The most effective values to test include:
- Zero: Often reveals special cases and simplifies expressions
- One: Useful for expressions involving exponents or fractions
- Negative one: Tests behavior with negative values
- Large positive numbers: Reveals which terms dominate in complex expressions
- Fractions between 0 and 1: Important for expressions involving powers or reciprocals
- Negative numbers: Tests whether relationships reverse with sign changes
If testing different values produces different relationships (sometimes A is greater, sometimes B is greater), the answer must be (D). If all tested values produce the same relationship, that relationship likely holds for all values, but verification through algebraic reasoning is recommended.
Estimation Techniques
Effective estimation is crucial for efficient data comparison. Rather than calculating exact values, test-takers should develop the ability to determine relationships through approximation:
- Benchmark comparison: Compare both quantities to a convenient reference value
- Order of magnitude: Determine whether quantities differ by factors of 10 or more
- Fraction approximation: Round fractions to nearby simple values (e.g., 49/101 ≈ 1/2)
- Percentage estimation: Use mental math for approximate percentage calculations
- Geometric visualization: Estimate areas, angles, or lengths from figures
Variable Constraints
Pay careful attention to any constraints placed on variables in the centered information. Statements like "x > 0," "n is an integer," or "0 < y < 1" dramatically affect which values are valid for testing and may determine whether answer (D) is possible.
Common constraint types:
- Sign restrictions (positive, negative, non-negative)
- Integer requirements
- Range limitations (bounded intervals)
- Relationship constraints (x > y, a + b = 10)
- Type specifications (prime numbers, even integers, etc.)
Algebraic Comparison Strategies
When both quantities contain algebraic expressions, several approaches prove effective:
Subtraction method: Calculate Quantity A minus Quantity B. If the result is always positive, A is greater; if always negative, B is greater; if the sign depends on variable values, the answer is (D).
Common factor extraction: Factor out common terms to simplify comparison. For example, comparing 7x² and 5x² reduces to comparing 7 and 5 when x² is positive.
Expression transformation: Rewrite one or both quantities in equivalent forms that make comparison easier, such as converting to common denominators or factoring.
Concept Relationships
Data comparison serves as an integrative framework that connects multiple mathematical domains. The core comparison process → requires → understanding of inequalities and number properties. Strategic simplification → builds upon → algebraic manipulation skills and inequality preservation rules. Testing strategic values → applies → knowledge of how different number types (integers, fractions, negative numbers) behave in expressions.
The relationship between estimation techniques and exact calculation represents a critical decision point in every data comparison question. Estimation → enables → faster problem-solving but → requires → strong number sense and confidence in approximation accuracy. The choice between these approaches → depends on → the complexity of the expressions and the clarity of the relationship.
Variable constraints → directly determine → whether answer choice (D) is possible, creating a logical connection between the problem setup and the solution space. When no variables exist → the relationship is fixed → eliminating answer (D) as a possibility. This connection to prerequisite knowledge of inequalities and algebraic reasoning makes data comparison a higher-order skill that synthesizes multiple mathematical concepts.
High-Yield Facts
⭐ Answer choice (D) is only possible when variables or unknowns appear in the problem; pure numerical comparisons never have (D) as the correct answer
⭐ You can add or subtract the same value from both quantities without changing their relationship
⭐ Multiplying or dividing both quantities by a negative number reverses the inequality relationship
⭐ If testing different values for a variable produces different relationships, the answer must be (D)
⭐ Squaring both quantities only preserves the relationship when both quantities are known to be non-negative
- When both quantities contain a common positive factor, you can divide both by that factor to simplify
- Zero and one are the most revealing values to test for expressions involving variables
- Fractions between 0 and 1 become smaller when squared, while numbers greater than 1 become larger when squared
- If Quantity A could be greater in some cases and Quantity B could be greater in others, choose (D) immediately without further calculation
- Geometric figures are not necessarily drawn to scale unless explicitly stated, affecting comparison strategies
- The centered information applies to both quantities equally and often provides the key to efficient comparison
- When comparing fractions with positive denominators, cross-multiplication is valid for determining which is larger
- Expressions involving absolute values require testing both positive and negative cases for variables
- The difference between "could be" and "must be" is critical: answer (D) means the relationship could vary, not that it's unknown
- Time spent simplifying before comparing is almost always more efficient than calculating exact values for both quantities
Quick check — test yourself on Data comparison so far.
Try Flashcards →Common Misconceptions
Misconception: If you cannot immediately see which quantity is larger, the answer must be (D). → Correction: Answer (D) only applies when the relationship genuinely varies based on possible values of variables. Difficulty in comparison does not indicate an indeterminate relationship; it may simply require more analysis or calculation.
Misconception: You can always square both quantities to eliminate square roots and simplify comparison. → Correction: Squaring only preserves the inequality relationship when both quantities are known to be non-negative. If either quantity could be negative, squaring can reverse the relationship or create false equivalences.
Misconception: When variables appear, you must test every possible value to be certain of the relationship. → Correction: Strategic testing of key values (especially 0, 1, -1, and fractions between 0 and 1) usually reveals whether the relationship is constant or variable. If two different test values produce the same relationship and algebraic reasoning confirms this pattern, the answer is determined.
Misconception: The quantities must be calculated to exact numerical values before comparison is possible. → Correction: Estimation, simplification, and relative comparison techniques often determine the relationship without exact calculation. The GRE rewards efficient reasoning over computational thoroughness.
Misconception: Geometric figures in data comparison questions accurately represent the relationships shown. → Correction: Unless explicitly stated as "drawn to scale," figures may be deliberately misleading. Rely on given measurements and geometric principles rather than visual appearance when comparing quantities.
Misconception: If Quantity A is an expression like "x²" and Quantity B is "x," then A must be greater because squaring makes numbers larger. → Correction: This relationship depends entirely on the value of x. When 0 < x < 1, squaring makes the value smaller (x² < x). When x > 1, squaring makes it larger (x² > x). When x = 0 or x = 1, they're equal. The answer would be (D) without additional constraints.
Misconception: Complex expressions always require complete simplification before comparison. → Correction: Often, partial simplification or strategic manipulation of just one quantity reveals the relationship. Complete simplification of both quantities wastes time when the relationship becomes clear earlier in the process.
Worked Examples
Example 1: Algebraic Expression Comparison
Problem Setup:
- Centered information: x > 1
- Quantity A: x² - x
- Quantity B: x
Solution Process:
Step 1: Recognize that both quantities contain x, suggesting simplification is possible.
Step 2: Use the subtraction method. Calculate Quantity A - Quantity B:
(x² - x) - x = x² - 2x = x(x - 2)Step 3: Analyze the sign of x(x - 2) given that x > 1.
- We know x is positive (x > 1)
- We need to determine the sign of (x - 2)
Step 4: Consider two cases within the constraint x > 1:
- If 1 < x < 2: then (x - 2) is negative, so x(x - 2) is negative, meaning Quantity A < Quantity B
- If x > 2: then (x - 2) is positive, so x(x - 2) is positive, meaning Quantity A > Quantity B
- If x = 2: then x(x - 2) = 0, meaning Quantity A = Quantity B
Step 5: Since the relationship changes depending on the value of x (even within the given constraint), the answer is (D) The relationship cannot be determined.
Key Learning Points: This example demonstrates that constraints on variables don't always eliminate answer (D). Even when x > 1, the relationship between the quantities varies. The subtraction method efficiently revealed this variability without requiring testing multiple values.
Example 2: Strategic Simplification with Fractions
Problem Setup:
- Centered information: a and b are positive numbers
- Quantity A: (a + 3)/(b + 3)
- Quantity B: a/b
Solution Process:
Step 1: Recognize that direct calculation won't help without specific values. Testing values is one approach, but algebraic reasoning is more definitive.
Step 2: Consider what happens when we add 3 to both numerator and denominator. This is equivalent to adding 3/b to the original fraction in a specific way.
Step 3: Use a strategic test value approach. Let's try a = 1, b = 1:
- Quantity A: (1 + 3)/(1 + 3) = 4/4 = 1
- Quantity B: 1/1 = 1
- In this case, they're equal.
Step 4: Try a = 2, b = 1:
- Quantity A: (2 + 3)/(1 + 3) = 5/4 = 1.25
- Quantity B: 2/1 = 2
- In this case, Quantity B is greater.
Step 5: Try a = 1, b = 2:
- Quantity A: (1 + 3)/(2 + 3) = 4/5 = 0.8
- Quantity B: 1/2 = 0.5
- In this case, Quantity A is greater.
Step 6: Since different positive values produce different relationships, the answer is (D) The relationship cannot be determined.
Alternative Algebraic Approach: Compare by cross-multiplication (valid since both denominators are positive):
- Quantity A > Quantity B when: (a + 3)b > a(b + 3)
- Simplifying: ab + 3b > ab + 3a
- Further: 3b > 3a, or b > a
This shows that Quantity A is greater when b > a, Quantity B is greater when a > b, and they're equal when a = b. This confirms answer (D).
Key Learning Points: This example illustrates two valid approaches—strategic value testing and algebraic manipulation. Both lead to the same conclusion. The problem also demonstrates that adding the same value to both numerator and denominator of a fraction changes the fraction's value in ways that depend on the original fraction's relationship to 1.
Exam Strategy
Approaching Data Comparison Questions
Begin every data comparison question by reading the centered information carefully and noting any constraints on variables. Before performing any calculations, ask: "Are there variables that could take different values?" If the answer is no (pure numbers only), immediately eliminate answer choice (D) from consideration.
Trigger words and phrases to watch for:
- "x is a positive integer" → limits possible values but doesn't eliminate (D)
- "The figure is drawn to scale" → rare but important; allows visual estimation
- "x > y > 0" → establishes ordering and sign constraints
- "n is even" → restricts to specific subset of integers
- "0 < a < 1" → indicates fraction behavior where squaring decreases value
Process of Elimination Strategies
- Eliminate (D) first if no variables exist in the problem
- Eliminate (C) if quick estimation shows the quantities are clearly different magnitudes
- Eliminate (A) and (B) if testing one value makes them equal and testing another maintains equality
- Choose (D) immediately if testing two different values produces different relationships
Time Allocation Approach
Allocate no more than 60 seconds to data comparison questions initially. If the relationship isn't clear within this timeframe, mark the question for review and make an educated guess. The four answer choices provide a 25% baseline probability, but strategic elimination often improves odds to 33% or 50% even without complete solution.
Time-saving priorities:
- Spend 5-10 seconds on initial assessment before calculating
- Use estimation whenever quantities differ by more than 10%
- Simplify before calculating exact values
- Test zero and one first when checking variable behavior
- Skip complex algebraic manipulation if testing values is faster
Common Question Patterns
Pattern 1: Hidden equality - Quantities that appear different but simplify to the same value (Answer C)
Pattern 2: Dominant term - One quantity contains a term that grows faster than anything in the other quantity (Answer A or B)
Pattern 3: Sign dependency - Relationship reverses based on whether a variable is positive or negative (Answer D)
Pattern 4: Boundary case - Relationship changes at a specific value like x = 1 or x = 0 (Answer D)
Exam Tip: If you've spent 30 seconds simplifying and still can't see the relationship clearly, test x = 0 and x = 1. These two values reveal the answer in approximately 70% of variable-based comparison questions.
Memory Techniques
SAND Mnemonic for when answer (D) is possible:
- Sign unknown (variable could be positive or negative)
- Any value possible (no sufficient constraints)
- No fixed relationship (testing shows variation)
- Depends on the variable
"Add and Subtract Safely" - Remember that adding or subtracting the same value from both quantities never changes the relationship, making this the safest simplification technique.
"Multiply with Care" - Visualize a scale: multiplying both sides by a positive number keeps the scale balanced in the same direction, but multiplying by a negative number flips the scale.
The "0, 1, -1" Trinity - These three values reveal more about variable behavior than any other numbers. Test them first, in this order, for maximum efficiency.
"Positive Squared, Negative Scared" - Only square both quantities when you're certain both are positive (or both negative). If signs are unknown, be "scared" to square.
COMPARE Acronym for systematic approach:
- Centered information first
- Observe both quantities
- Mark any variables
- Plan your strategy
- Apply simplification
- Review the relationship
- Eliminate and select
Summary
Data comparison questions constitute the largest single question type on the GRE Quantitative Reasoning section, requiring test-takers to determine the relationship between two quantities rather than calculate exact values. Success depends on mastering four key skills: recognizing when answer choice (D) is possible (only with variables), applying valid simplification operations that preserve relationships, testing strategic values efficiently when variables appear, and choosing estimation over exact calculation when appropriate. The four answer choices remain constant across all questions, and understanding the logical conditions for each choice is fundamental. Strategic simplification through adding/subtracting the same value from both quantities or dividing by common positive factors often reveals relationships without extensive calculation. When variables exist, testing values like 0, 1, -1, and fractions between 0 and 1 typically determines whether the relationship is constant or variable. Time efficiency is critical—spending more than 60 seconds on a single comparison question sacrifices time needed for more complex problems elsewhere in the section.
Key Takeaways
- Data comparison questions always present exactly four answer choices, with (D) only possible when variables or unknowns exist in the problem
- Adding or subtracting the same value from both quantities preserves their relationship, making this the safest simplification technique
- Multiplying or dividing both quantities by a negative number reverses the inequality, requiring careful attention to sign
- Testing strategic values (especially 0, 1, and -1) efficiently determines whether relationships vary with different variable values
- Estimation and strategic simplification are almost always faster than calculating exact values for both quantities
- If two different test values produce different relationships (A greater in one case, B greater in another), immediately select answer (D)
- The centered information applies to both quantities and often contains the key constraint or relationship needed for efficient comparison
Related Topics
Quantitative Comparison with Geometry: Extends data comparison techniques to geometric figures, areas, volumes, and angle relationships. Mastering basic data comparison provides the foundation for efficiently comparing geometric quantities without extensive calculation.
Inequalities and Absolute Values: Deepens understanding of how relationships between quantities behave under various operations. The inequality preservation rules learned in data comparison apply directly to solving complex inequality problems.
Data Interpretation: Applies comparison skills to information presented in graphs, charts, and tables. The estimation techniques developed for data comparison transfer directly to quickly analyzing graphical data.
Algebraic Expressions and Factoring: Builds on the simplification strategies used in data comparison, extending them to more complex algebraic manipulation required in problem-solving questions.
Number Properties: Explores how different types of numbers (integers, fractions, positive, negative) behave in expressions, directly supporting the strategic value testing approach in data comparison.
Practice CTA
Now that you've mastered the core concepts and strategies for data comparison, it's time to put your knowledge into action. Attempt the practice questions to reinforce these techniques and build the speed and confidence needed for test day. Focus on applying the systematic approach outlined in this guide: identify variables, choose your strategy, simplify efficiently, and verify your answer. Each practice question you complete strengthens your pattern recognition and decision-making skills. Remember, data comparison questions reward strategic thinking over computational effort—practice working smarter, not harder. Review the flashcards to cement the high-yield facts and common patterns in your memory. Your investment in mastering this high-frequency question type will pay significant dividends in your overall Quantitative Reasoning score!
Sign up free to keep reading
Create a free AnvayaPrep account to finish this GRE guide on Data comparison — plus flashcards and practice questions.