Overview
Data word problems represent a critical category of quantitative reasoning questions on the GRE that require students to interpret, analyze, and manipulate numerical information presented in written form. Unlike straightforward computational problems, these questions embed mathematical relationships within real-world scenarios involving statistics, measurements, rates, percentages, and comparisons. Students must extract relevant data from prose, identify the appropriate mathematical operations, and execute calculations accurately—all while managing time pressure and avoiding common traps.
The GRE frequently tests data word problems because they assess multiple competencies simultaneously: reading comprehension, logical reasoning, mathematical fluency, and problem-solving strategy. These questions appear throughout the Quantitative Reasoning section in both multiple-choice and numeric entry formats, often accounting for 20-30% of all quantitative questions. Mastery of gre data word problems directly correlates with higher scores because these questions separate students who merely memorize formulas from those who can apply mathematical thinking flexibly to novel situations.
Within the broader landscape of Quantitative Reasoning, data word problems serve as an integrative topic that draws upon arithmetic, algebra, statistics, and data interpretation skills. They bridge the gap between abstract mathematical concepts and practical applications, requiring students to translate verbal descriptions into mathematical expressions. This topic connects directly to data interpretation questions involving charts and graphs, as both require extracting quantitative information and performing appropriate calculations. Understanding data word problems also strengthens performance on other word problem types, including rate problems, mixture problems, and probability scenarios.
Learning Objectives
- [ ] Identify when Data word problems is being tested
- [ ] Explain the core rule or strategy behind Data word problems
- [ ] Apply Data word problems to GRE-style questions accurately
- [ ] Translate verbal descriptions of data relationships into mathematical expressions and equations
- [ ] Distinguish between relevant and irrelevant information in complex word problems
- [ ] Recognize common data word problem patterns and select appropriate solution strategies
- [ ] Verify answers by checking units, reasonableness, and alignment with the question asked
Prerequisites
- Basic arithmetic operations: Essential for performing calculations with the extracted data, including addition, subtraction, multiplication, division, and working with fractions, decimals, and percentages
- Algebraic manipulation: Required for setting up equations from verbal descriptions and solving for unknown variables
- Ratio and proportion concepts: Necessary for understanding comparative relationships and scaling problems commonly found in data word problems
- Percentage calculations: Fundamental for interpreting increases, decreases, and proportional relationships expressed in percentage terms
- Statistical measures: Understanding of mean, median, mode, and range helps interpret data summaries and central tendency questions
Why This Topic Matters
Data word problems reflect the type of quantitative reasoning required in graduate-level coursework and professional settings. Whether analyzing research data, interpreting financial reports, or evaluating experimental results, graduate students must extract numerical information from written sources and perform appropriate analyses. The GRE uses these problems to predict academic readiness for programs requiring data literacy.
On the GRE, data word problems appear with high frequency—typically 4-7 questions per test across both Quantitative Reasoning sections. They manifest in several formats: single-answer multiple choice, multiple-answer multiple choice, and numeric entry questions. These problems often integrate with other question types, appearing alongside data interpretation sets or within comparison questions. The difficulty range spans from straightforward single-step calculations to complex multi-step problems requiring strategic planning.
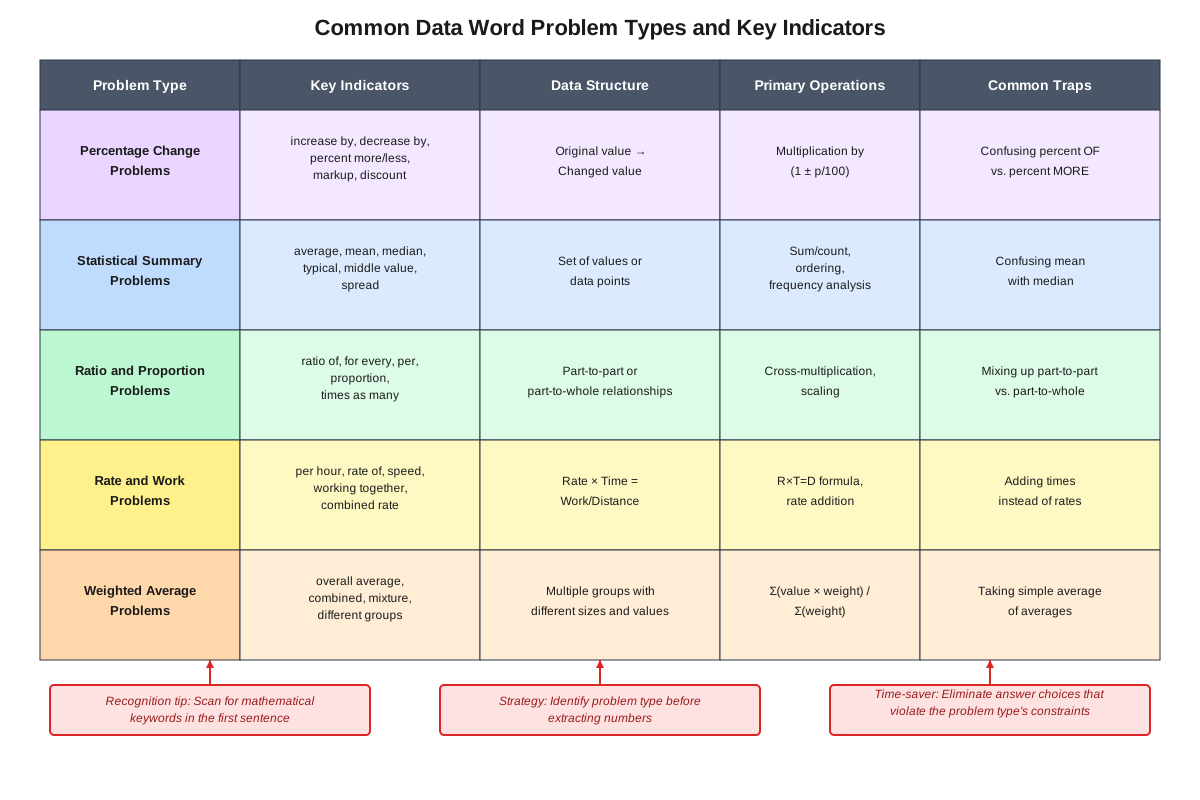
Common manifestations include: population and demographic statistics (comparing growth rates, calculating totals), financial scenarios (profit margins, price changes, investment returns), measurement conversions and unit analysis, survey results and sampling data, rate and work problems expressed through data, and probability scenarios involving real-world events. The GRE particularly favors problems requiring percentage calculations, weighted averages, and proportional reasoning embedded within realistic contexts.
Core Concepts
Understanding Data Word Problem Structure
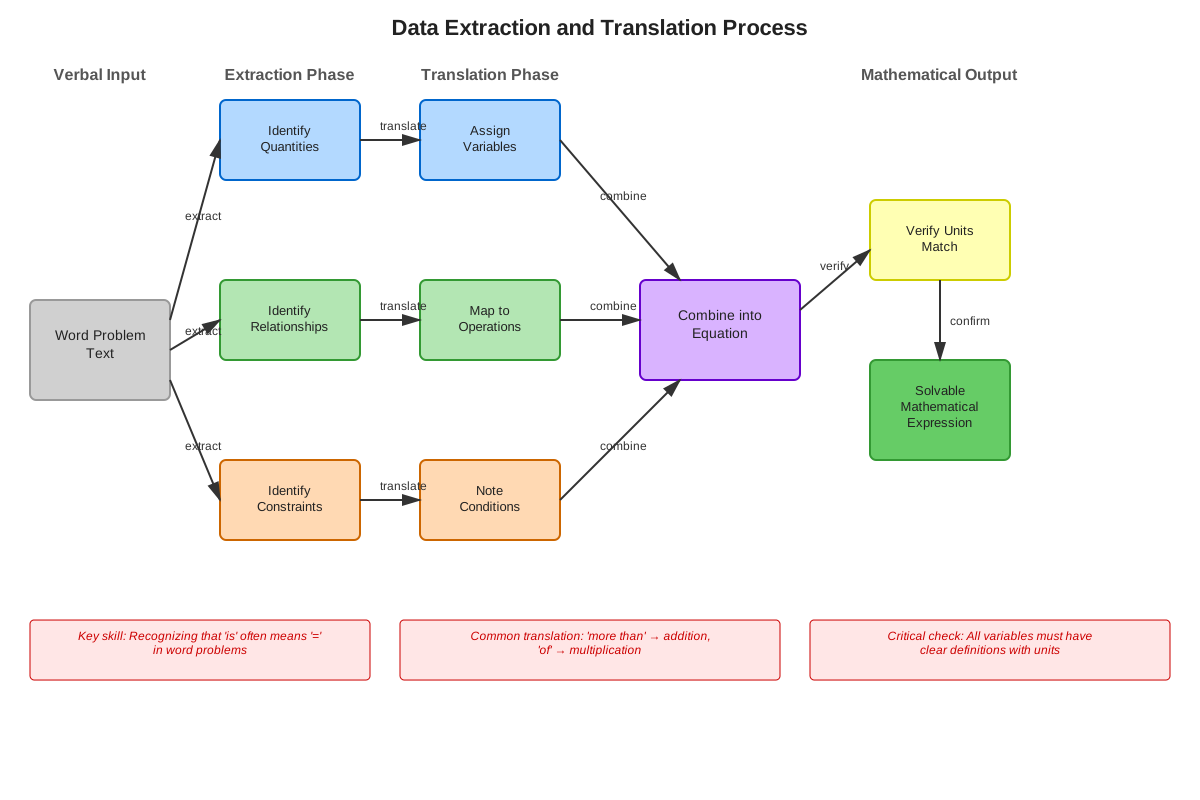
Data word problems present quantitative information through narrative text rather than equations or visual displays. The fundamental challenge involves parsing language to identify: (1) what quantities are given, (2) what relationships exist between quantities, (3) what the question asks for, and (4) what mathematical operations will yield the answer. Successful problem-solving requires systematic extraction of numerical data and careful attention to units, time frames, and comparison bases.
The typical structure includes a context-setting introduction, specific numerical data points, relationships or constraints, and a question targeting a specific calculation. Not all information provided is necessarily relevant—the GRE deliberately includes extraneous data to test discrimination skills. Students must identify which numbers and relationships matter for answering the specific question posed.
Key Data Relationships and Operations
Data word problems test several fundamental relationship types:
Absolute vs. Relative Change: Problems frequently distinguish between absolute differences (the actual numerical change) and relative differences (percentage change or ratio). For example, "Sales increased by 50 units" describes absolute change, while "Sales increased by 50%" describes relative change. Confusing these represents a common error source.
Part-to-Whole Relationships: Many problems involve calculating portions of totals, requiring understanding of fractions, decimals, and percentages. The relationship can be expressed as: Part = (Percentage/100) × Whole, or rearranged to solve for any component.
Weighted Averages: When combining groups with different sizes or values, simple averaging fails. The weighted average formula accounts for the relative importance of each component:
Weighted Average = (w₁×v₁ + w₂×v₂ + ... + wₙ×vₙ) / (w₁ + w₂ + ... + wₙ)where w represents weights (frequencies, quantities) and v represents values.
Rate Relationships: Problems involving rates (speed, work rate, price per unit) follow the fundamental relationship: Total = Rate × Base. For example, Total Cost = Unit Price × Quantity, or Distance = Speed × Time.
The Translation Process
Converting verbal descriptions into mathematical expressions requires recognizing linguistic cues:
| Verbal Phrase | Mathematical Operation | Example |
|---|---|---|
| "increased by," "more than," "sum of" | Addition (+) | "15 more than x" → x + 15 |
| "decreased by," "less than," "difference" | Subtraction (−) | "20 less than y" → y − 20 |
| "times," "product of," "of" (with fractions/%) | Multiplication (×) | "30% of 80" → 0.30 × 80 |
| "per," "out of," "ratio of" | Division (÷) | "60 miles per 2 hours" → 60 ÷ 2 |
| "is," "equals," "results in" | Equals (=) | "x is 5" → x = 5 |
Multi-Step Problem Strategy
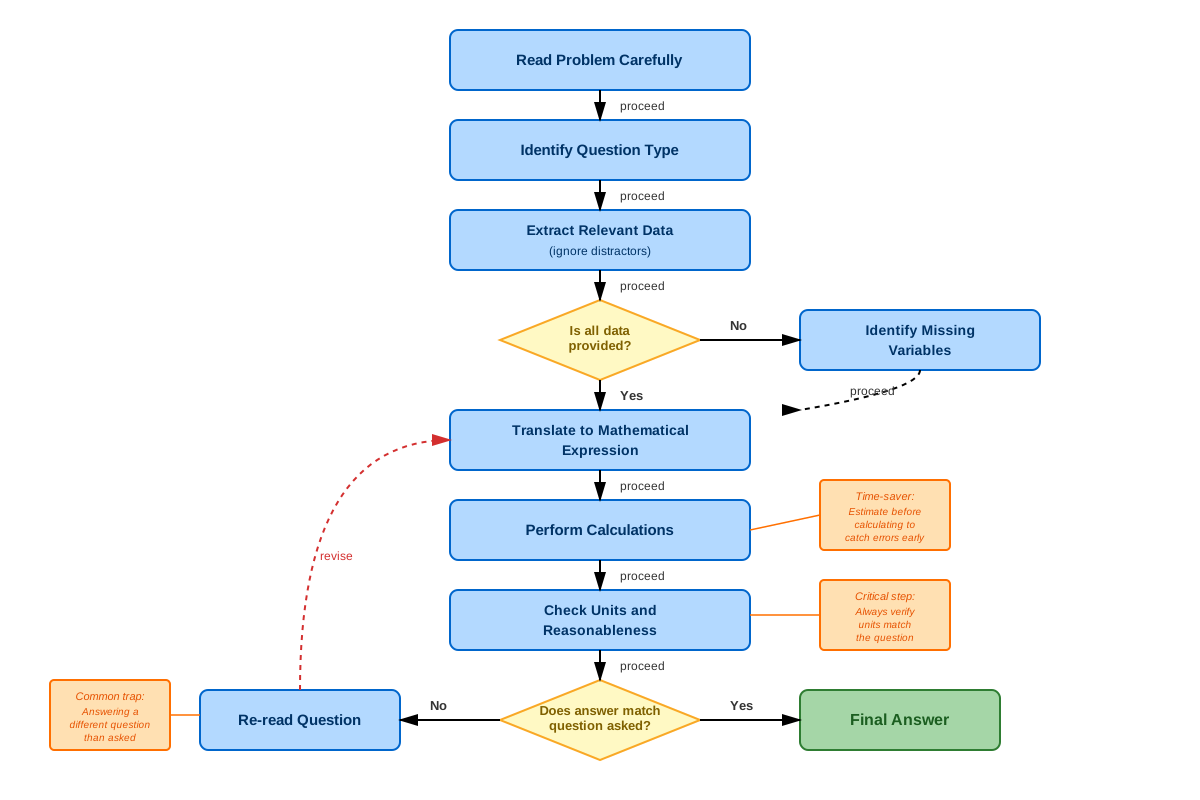
Complex data word problems require multiple operations in sequence. The systematic approach involves:
- Read completely first: Understand the full context before calculating
- Identify the target: Determine exactly what the question asks for
- Extract relevant data: List given quantities with units and labels
- Map relationships: Determine how given data connects to the target
- Plan the solution path: Outline required steps before calculating
- Execute calculations: Perform operations in logical order
- Verify the answer: Check units, reasonableness, and question alignment
Unit Analysis and Dimensional Consistency
Many data word problems involve different units that must be reconciled. Unit analysis (also called dimensional analysis) ensures calculations make logical sense. When multiplying or dividing quantities, track units through the calculation:
Example: If a car travels 120 miles in 2 hours, the speed is:
Speed = 120 miles / 2 hours = 60 miles/hourThe units (miles/hour) confirm this represents speed. If units don't match the expected answer type, an error occurred in the setup.
Percentage Applications in Data Problems
Percentage calculations appear frequently in GRE data word problems. Key formulas include:
- Percent change: ((New Value − Old Value) / Old Value) × 100%
- Finding a percentage of a number: (Percent/100) × Number
- Finding what percent one number is of another: (Part/Whole) × 100%
- Successive percentage changes: Cannot simply add percentages; must apply each change sequentially
Critical insight: A 20% increase followed by a 20% decrease does NOT return to the original value. If x increases by 20% to 1.2x, then decreases by 20%, the result is 1.2x × 0.8 = 0.96x (a net 4% decrease).
Data Comparison and Ranking
Some problems require comparing multiple data points or determining rankings. Strategies include:
- Convert to common units: Before comparing, ensure all quantities use the same measurement system
- Use common denominators: When comparing fractions, find a common denominator or convert to decimals
- Calculate per-unit values: For comparing efficiency or value, divide by the relevant base (per person, per hour, per dollar)
- Percentage comparison: When comparing growth rates or changes, use percentage change rather than absolute differences
Concept Relationships
The core concepts within data word problems form an interconnected system. The translation process serves as the foundation, enabling conversion of verbal descriptions into mathematical expressions. This translation feeds into identifying data relationships, which determines whether the problem involves absolute/relative change, part-whole relationships, weighted averages, or rates. Once relationships are identified, the multi-step problem strategy provides the procedural framework for solution execution.
Unit analysis operates as a verification tool throughout the problem-solving process, ensuring dimensional consistency from translation through final calculation. Percentage applications represent a specialized subset of data relationships that appear with such frequency they warrant dedicated attention. Finally, data comparison and ranking builds upon all previous concepts, requiring translation, relationship identification, and often percentage calculations to make valid comparisons.
These concepts connect to prerequisite knowledge: algebraic manipulation enables equation setup from translated expressions, ratio and proportion concepts underlie rate relationships and comparisons, and statistical measures inform interpretation of data summaries. The topic also connects forward to data interpretation questions (charts, graphs, tables), where similar analytical skills apply to visual rather than verbal data presentations.
High-Yield Facts
⭐ Data word problems account for approximately 20-30% of GRE Quantitative Reasoning questions, making them one of the highest-yield topics for focused study.
⭐ The question stem determines what to calculate—always identify exactly what is being asked before beginning calculations to avoid solving for the wrong quantity.
⭐ Percentage change is calculated as ((New − Old)/Old) × 100%, and the denominator is always the original (old) value, not the new value.
⭐ Successive percentage changes multiply, they don't add—a 10% increase followed by a 10% decrease results in a net 1% decrease (1.1 × 0.9 = 0.99).
⭐ Weighted averages require multiplying each value by its weight (frequency), then dividing by the sum of weights—simple averaging fails when groups have different sizes.
- Units must be consistent throughout calculations—convert all measurements to the same unit system before performing operations.
- "Of" typically signals multiplication when used with fractions or percentages (e.g., "1/3 of 60" means 1/3 × 60).
- Rate problems follow the fundamental relationship: Total = Rate × Base, which can be rearranged to solve for any component.
- Not all given information is relevant—the GRE includes extraneous data to test whether students can identify what matters for the specific question.
- Absolute change measures the actual numerical difference, while relative change measures the proportional or percentage difference—confusing these is a common error.
- When comparing data across different bases, convert to per-unit values (per person, per hour, per dollar) to make valid comparisons.
- The word "is" typically translates to an equals sign in mathematical expressions derived from word problems.
- Reading the entire problem before calculating prevents premature solving—understanding the full context often reveals shortcuts or clarifies what's actually needed.
- Answer verification should check three elements: correct units, reasonable magnitude, and alignment with the question asked.
Quick check — test yourself on Data word problems so far.
Try Flashcards →Common Misconceptions
Misconception: Adding successive percentage changes gives the total percentage change.
Correction: Successive percentage changes must be applied multiplicatively. A 20% increase followed by a 30% increase results in 1.20 × 1.30 = 1.56, representing a 56% total increase, not 50%. Each percentage change applies to the result of the previous change, not the original value.
Misconception: The denominator in percentage change calculations can be either the old or new value.
Correction: The denominator must always be the original (old) value when calculating percentage change. The formula is ((New − Old)/Old) × 100%. Using the new value as the denominator produces an incorrect result and represents a different calculation entirely.
Misconception: Weighted averages can be calculated by simply averaging the given values.
Correction: When groups have different sizes or frequencies, each value must be multiplied by its weight before averaging. For example, if 10 students average 80 and 20 students average 90, the overall average is (10×80 + 20×90)/(10+20) = 86.67, not (80+90)/2 = 85.
Misconception: All information provided in a word problem must be used in the solution.
Correction: The GRE deliberately includes extraneous information to test discrimination skills. Students must identify which data points are relevant to answering the specific question asked. Using unnecessary information often leads to incorrect, overly complex solutions.
Misconception: "Less than" and "subtracted from" mean the same thing in mathematical translation.
Correction: These phrases have opposite orders. "5 less than x" translates to x − 5, but "5 subtracted from x" also means x − 5. However, "x less than 5" means 5 − x. The order matters critically, and careful attention to phrasing prevents sign errors.
Misconception: Comparing absolute changes between different-sized groups provides meaningful insights.
Correction: Absolute changes can be misleading when comparing groups of different sizes. A company growing from 100 to 150 employees (50-person increase) shows more relative growth than one growing from 1000 to 1040 employees (40-person increase), despite the smaller absolute change. Percentage change or per-capita metrics enable valid comparisons.
Misconception: Unit conversion can be done after the final calculation.
Correction: Units must be consistent before performing calculations. Mixing units (e.g., adding miles and kilometers without conversion) produces meaningless results. Convert all measurements to a common unit system before executing mathematical operations.
Worked Examples
Example 1: Multi-Step Percentage Problem
Problem: A retail store had 240 customers on Monday. On Tuesday, the number of customers increased by 25%. On Wednesday, the number of customers decreased by 20% from Tuesday's total. How many customers visited the store on Wednesday?
Solution:
Step 1: Identify what's being asked
The question asks for the number of customers on Wednesday (after two successive changes).
Step 2: Extract relevant data
- Monday: 240 customers
- Tuesday: 25% increase from Monday
- Wednesday: 20% decrease from Tuesday
Step 3: Calculate Tuesday's customers
A 25% increase means multiplying by 1.25:
Tuesday = 240 × 1.25 = 300 customers
Step 4: Calculate Wednesday's customers
A 20% decrease means multiplying by 0.80:
Wednesday = 300 × 0.80 = 240 customers
Step 5: Verify the answer
Units check: customers (correct)
Reasonableness: The value returned to the original 240, which makes sense because a 25% increase followed by a 20% decrease doesn't cancel out (1.25 × 0.8 = 1.0)
Question alignment: We found Wednesday's total (✓)
Answer: 240 customers
Connection to learning objectives: This problem demonstrates identifying data word problem patterns (successive percentage changes), applying the core strategy (sequential calculation rather than adding percentages), and verifying the answer's reasonableness.
Example 2: Weighted Average Problem
Problem: In a graduate program, 60% of students are full-time with an average age of 24 years, while 40% are part-time with an average age of 32 years. What is the average age of all students in the program?
Solution:
Step 1: Identify what's being asked
The question asks for the overall average age (a weighted average).
Step 2: Recognize the problem type
This is a weighted average problem because the two groups have different sizes (60% vs. 40%).
Step 3: Set up the weighted average formula
We don't know the total number of students, but percentages work as weights:
Average = (Weight₁ × Value₁ + Weight₂ × Value₂) / (Weight₁ + Weight₂)
Step 4: Substitute values
Average = (60 × 24 + 40 × 32) / (60 + 40)
Average = (1440 + 1280) / 100
Average = 2720 / 100
Average = 27.2 years
Step 5: Verify the answer
Units check: years (correct)
Reasonableness: 27.2 falls between 24 and 32, closer to 24 because that group is larger (✓)
Question alignment: We found the overall average (✓)
Alternative approach: Using percentages as decimals:
Average = 0.60(24) + 0.40(32) = 14.4 + 12.8 = 27.2 years
Answer: 27.2 years
Connection to learning objectives: This problem illustrates translating a verbal description into a mathematical expression (weighted average formula), distinguishing relevant information (the percentages and ages, not the actual number of students), and applying the appropriate strategy for combined group averages.
Exam Strategy
Approaching GRE Data Word Problems
Initial Reading Strategy: Read the entire problem once without calculating to understand the context and identify what's being asked. On the second reading, extract and label numerical data. This prevents premature solving and helps identify extraneous information.
Trigger Words to Watch For:
- "Percent increase/decrease": Signals percentage change calculations; watch for successive changes
- "Average," "mean": May require weighted average if groups differ in size
- "Per," "rate," "each": Indicates rate problems using Total = Rate × Base
- "Ratio of," "compared to": Suggests proportional relationships or comparisons
- "More than," "less than": Pay careful attention to order for correct translation
- "Of" (with fractions/percentages): Typically means multiplication
Process of Elimination Tips
For multiple-choice data word problems:
- Eliminate answers with wrong units: If the question asks for a percentage, eliminate answers without % symbols
- Use estimation: Round numbers to quickly eliminate unreasonable answers before calculating precisely
- Check magnitude: If calculating a percentage increase, the answer must be larger than the original; eliminate contradictory options
- Test extreme cases: If a problem involves variables, test with simple numbers (like 0, 1, or 100) to eliminate impossible answers
Time Allocation Advice
Exam Tip: Allocate approximately 1.5-2 minutes per data word problem. If a problem requires more than 2.5 minutes, mark it for review and move on—returning with fresh perspective often reveals simpler approaches.
Time-saving strategies:
- Recognize patterns: Common problem types (percentage change, weighted average, rate problems) have standard solution templates
- Avoid unnecessary precision: The GRE rarely requires calculations beyond two decimal places; round intermediate steps when appropriate
- Use answer choices strategically: For numeric entry questions, estimate first; for multiple choice, work backwards from answers when direct solving seems complex
Common Traps and How to Avoid Them
The GRE deliberately constructs data word problems with predictable traps:
- Solving for the wrong quantity: Always circle or underline exactly what the question asks for
- Using extraneous information: Cross out irrelevant data after identifying what's needed
- Forgetting unit conversions: Write units next to every number throughout calculations
- Adding percentages that should multiply: Remember successive changes are multiplicative
- Comparing absolute changes across different bases: Convert to percentages or per-unit values for valid comparisons
Memory Techniques
Mnemonics for Key Concepts
PERCENT for percentage change problems:
- Pick the original value (denominator)
- Evaluate the difference (New − Old)
- Ratio: divide difference by original
- Convert to percentage (multiply by 100)
- Ensure sign is correct (positive for increase, negative for decrease)
- Never add successive percentage changes
- Test your answer for reasonableness
WAVE for weighted average problems:
- Weights must be identified (frequencies, quantities, percentages)
- Apply multiplication: weight × value for each group
- Verify the sum of all products
- Evaluate: divide by sum of weights
Visualization Strategies
For percentage problems: Visualize a number line with the original value at 0%, increases moving right, decreases moving left. Successive changes move along this line sequentially, not additively.
For rate problems: Draw a simple diagram showing the relationship between Total, Rate, and Base as a triangle:
    Total
    /  \
Rate × Base
Cover the unknown to see the operation needed (Total = Rate × Base, Rate = Total/Base, Base = Total/Rate).
For comparison problems: Create a simple table with rows for each item being compared and columns for relevant attributes. This visual organization clarifies which calculations enable valid comparisons.
Acronyms for Problem-Solving Steps
STAR approach for systematic problem-solving:
- Scan: Read the entire problem and identify the question
- Translate: Convert verbal descriptions to mathematical expressions
- Analyze: Determine the solution path and required operations
- Resolve: Execute calculations and verify the answer
Summary
Data word problems represent a high-yield GRE topic that integrates reading comprehension with quantitative reasoning. Success requires systematic extraction of numerical information from prose, translation of verbal descriptions into mathematical expressions, and strategic application of appropriate operations. The core challenge involves distinguishing relevant from extraneous information, recognizing common problem patterns (percentage change, weighted averages, rate relationships, part-whole calculations), and executing multi-step solutions accurately. Critical skills include understanding that successive percentage changes multiply rather than add, weighted averages require multiplying values by their frequencies, and valid comparisons across different bases require per-unit or percentage calculations. The systematic approach—reading completely, identifying the target, extracting relevant data, mapping relationships, planning the solution path, executing calculations, and verifying answers—provides a reliable framework for tackling even complex problems efficiently. Mastery of data word problems directly enhances GRE Quantitative Reasoning scores because these questions test the flexible application of mathematical thinking to realistic scenarios, separating students who understand concepts from those who merely memorize procedures.
Key Takeaways
- Data word problems test integrated skills: reading comprehension, mathematical translation, strategic problem-solving, and computational accuracy all contribute to success
- Systematic approach beats rushing: Reading completely, identifying exactly what's asked, and planning before calculating prevents common errors and saves time
- Percentage change always uses the original value as the denominator: ((New − Old)/Old) × 100%, and successive changes multiply (1.20 × 1.30 = 1.56, not 1.50)
- Weighted averages require multiplying each value by its weight: Simple averaging fails when groups have different sizes; use (w₁v₁ + w₂v₂)/(w₁ + w₂)
- Not all given information is relevant: The GRE includes extraneous data to test discrimination; identify what's needed for the specific question asked
- Unit consistency is non-negotiable: Convert all measurements to common units before calculating, and track units throughout to verify dimensional consistency
- Pattern recognition accelerates solving: Common problem types (percentage change, weighted average, rate problems) have standard solution templates that save time once recognized
Related Topics
Data Interpretation (Charts and Graphs): Builds directly on data word problem skills by presenting quantitative information visually rather than verbally; mastering data word problems provides the analytical foundation for extracting and manipulating information from tables, bar graphs, line graphs, and pie charts.
Rate and Work Problems: A specialized subset of data word problems focusing on relationships involving time, distance, speed, work completion, and combined rates; the translation and relationship-mapping skills developed here apply directly to these more specific scenarios.
Statistics and Probability Word Problems: Extends data word problem skills to scenarios involving measures of central tendency, variability, and likelihood; understanding how to extract and manipulate data from verbal descriptions enables tackling more complex statistical reasoning questions.
Algebraic Word Problems: Requires translating verbal descriptions into equations with variables, then solving algebraically; the translation skills developed in data word problems transfer directly, with added complexity of unknown quantities.
Quantitative Comparison with Word Problems: Combines data word problem interpretation with the unique format of comparing two quantities without necessarily calculating exact values; mastery of data word problems enables strategic estimation and comparison techniques.
Practice CTA
Now that you've mastered the core concepts, strategies, and common patterns in data word problems, it's time to solidify your understanding through active practice. Attempt the practice questions designed specifically for this topic, focusing on applying the systematic STAR approach and recognizing the problem patterns discussed. Use the flashcards to reinforce key formulas, translation rules, and common traps. Remember: data word problems reward careful reading and strategic thinking more than computational speed. Each practice problem you work through strengthens your pattern recognition and builds the confidence needed to tackle these high-yield questions efficiently on test day. You've built a strong foundation—now apply it!
Sign up free to keep reading
Create a free AnvayaPrep account to finish this GRE guide on Data word problems — plus flashcards and practice questions.